> For the complete documentation index, see [llms.txt](https://docs.prismacloud.io/llms.txt). Markdown versions of documentation pages are available by appending `.md` to page URLs; this page is available as [Markdown](https://docs.prismacloud.io/admin-guide/32/alerts/webhook.md).
# Webhook
Prisma Cloud offers native integration with a number of services, including email, JIRA, and Slack. When no native integration is available, webhooks provide a mechanism to interface Prisma Cloud’s alert system with virtually any third-party service.
A webhook is an HTTP callback. When an event occurs, Prisma Cloud notifies your web service with an HTTP POST request. The request contains a JSON body that you configure when you set up the webhook. A webhook configuration consists of:
* URL
* Custom JSON body
* Credentials
* CA Certificate
## Custom JSON body
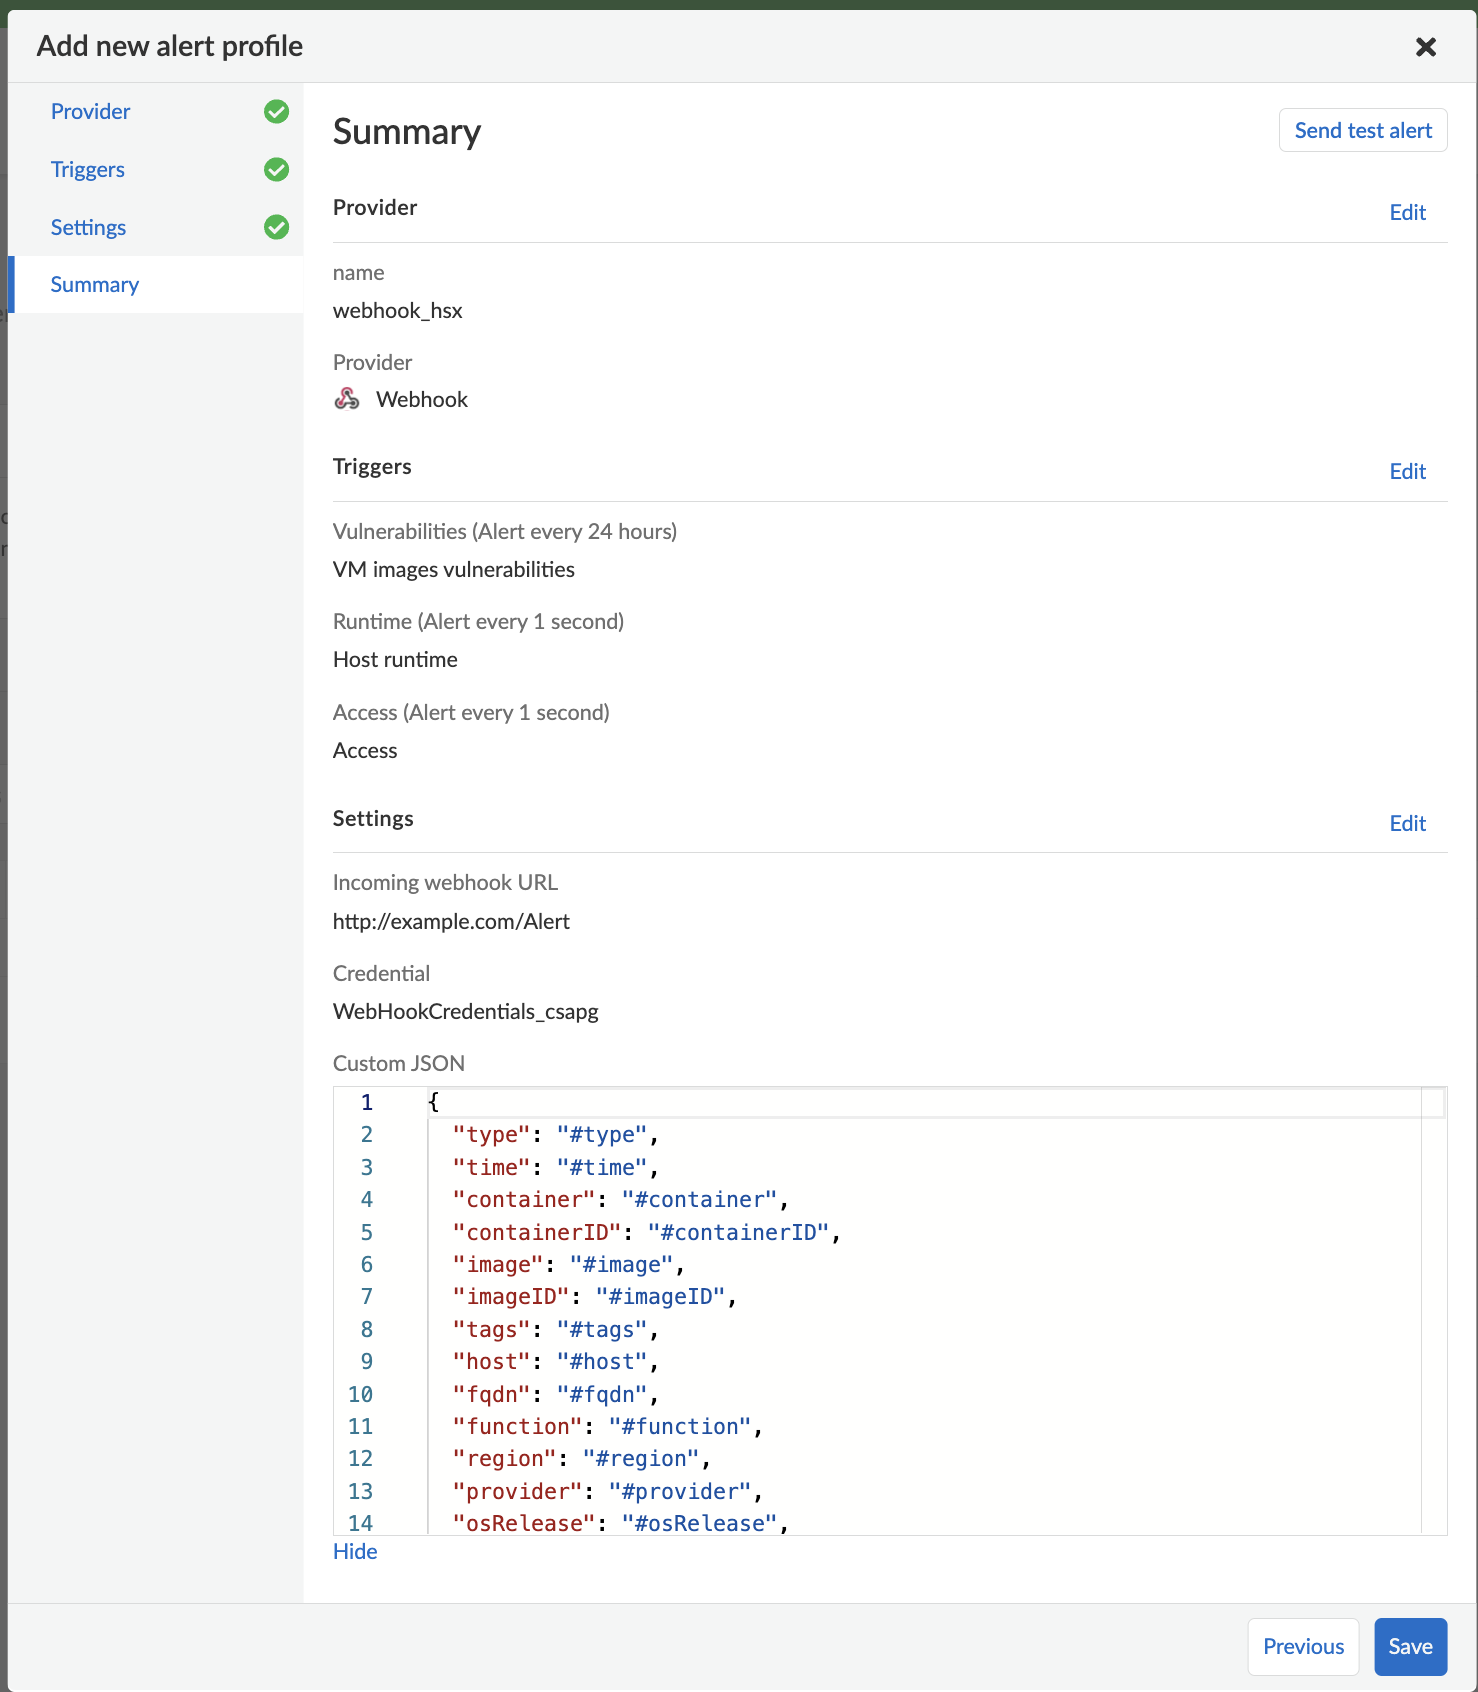
You can customize the body of the POST request with values of interest. The content of the JSON object in the request body is defined using predefined macros. For example:
```json
{
"type":#type,
"host":#host,
"details":#message
}
```
When an event occurs, Prisma Cloud replaces the macros in your custom JSON with real values and then submits the request.
```json
{
"type":"ContainerRuntime",
"host":"host1",
"details":"/bin/cp changed binary /bin/busybox MD5:XXXXXXX"
}
```
All supported macros are described in the following table. Not all macros are applicable to all alert types.
| Rule | Description |
| --------------------------- | ---------------------------------------------------------------------------------------------------------------------------------------------------------------------------------------------------------------------------------------------------------------------------------------------------- |
| `#type` | Audit alert type. For example, 'Container Runtime'. |
| `#time` | Audit alert time. For example, 'Jan 21, 2018 UTC'. |
| `#container` | Impacted container. |
| `#image` | Impacted image. |
| `#imageID` | The ID of the impacted image. For example, 'sha256:13b66b487594a1f2b75396013bc05d29d9f527852d96c5577cc4f187559875d0'. |
| `#tags` | The tags of the impacted resource. |
| `#host` | Hostname for the host where the audit occurred. |
| `#fqdn` | Fully qualified domain name for the host where the audit occurred. |
| `#function` | Serverless function where the audit occurred. |
| `#region` | Region where the audit occurred. For example, 'N. Virginia'. |
| `#provider` | The cloud provider in which the alert was detected. For example, 'aws'. |
| `#osRelease` | The OS on which the alert occurred. For example, 'stretch'. |
| `#osDistro` | The OS distro on which the alert occurred. For example, 'Debian GNU/Linux 9'. |
| `#runtime` | Language runtime in which the audit occurred. For example, 'python3.6'. |
| `#appID` | Serverless or Function name. |
| `#rule` | Rule which triggered the alert. |
| `#message` | Associated alert message. |
| `#aggregated` \[Deprecated] | All fields in the audit message as a single JSON object. |
| `#aggregatedAlerts` |
Returns the aggregated audit events in JSON format.
NOTE: For the existing webhook alerts, you can edit the custom JSON body and replace #aggregated macro with #aggregatedAlerts macro.
|
| `#rest` \[Deprecated] | All subsequent alerts that occurred during the aggregation period, in JSON format. |
| `#dropped` |
The number of alerts dropped after the aggregation buffer has reached its limit.
NOTE: For the existing webhook alerts, you can edit the custom JSON body to add the #dropped macro.
|
| `#forensics` | API link to download the forensics data for the incident. |
| `#accountID` | The cloud account ID in which the audit was detected. |
| `#category` | Audit alert category. For example 'unexpectedProcess'. |
| `#command` | The command which triggered the runtime audit. |
| `#startupProcess` | The executed process is activated when the container is initiated. |
| `#labels` | A list of the alert labels of the resource in which the audit was detected. |
| `#collections` | A list of the associated collections for the resource where the issue was detected. |
| `#complianceIssues` |
The compliance issues detected in the latest scan of the resource.
A single alert includes compliance issues for a single resource.
|
| `#vulnerabilities` |
The new vulnerabilities detected in the latest scan.
A single alert includes vulnerabilities for all resources where new vulnerabilities were found, so the vulnerabilities macro includes the data about the resources as well. All other macros, except type and time, will be empty.
|
| `#clusters` | The clusters on which the alert was detected. |
| `#namespaces` | List of the Kubernetes namespaces associated with the running image. |
| `#accountIDs` | The cloud account IDs in which the alert was detected. Use this macro when the resource may run on multiple accounts. |
The `#vulnerabilities` and `#complianceIssues` macros include inner structures. Below is an example of their content. Notice that the structure is subject to minor changes between versions.
```json
{
"vulnerabilities": [
{
"imageName": "ubuntu@sha256:c95a8e48bf...", [only for image vulnerabilities]
"imageID": "sha256:f643c72bc25212974c1...", [only for image vulnerabilities]
"hostname": "console.compute.internal", [only for host vulnerabilities]
"distribution": "Ubuntu 20.04.1 LTS",
"labels": {
"key1": "value1",
"key2": "value2"
},
"collections": [
"All",
"collection1",
"collection2"
],
"newVulnerabilities": [
{
"severity": "High",
"vulnerabilities": [
{
"cve": "CVE-2020-1971",
"severity": "high",
"link": "https://people.canonical.com/~ubuntu-security/cve/2020/CVE-2020-1971",
"status": "Fixed in: 1.0.1f-1ubuntu2.27+esm2",
"packages": "openssl",
"packageVersion": "1.0.1f-1ubuntu2.27"
},
... more vulnerabilities
]
},
{
"severity": "Low",
"vulnerabilities": [
{
"cve": "CVE-2019-25013",
"severity": "low",
"link": "https://people.canonical.com/~ubuntu-security/cve/2019/CVE-2019-25013",
"status": "needed",
"packages": "libc-dev-bin,libc6-dev,libc6,libc-bin",
"packageVersion": "2.31-0ubuntu9.1",
"sourcePackage": "glibc"
},
... more vulnerabilities
]
}
]
},
... more images/hosts
]
}
```
```json
{
"complianceIssues": [
{
"title": "(CIS_Docker_v1.2.0 - 4.1) Image should be created with a non-root user",
"id": "41",
"description": "It is a good practice to run the container as a non-root user, if possible...",
"type": "image",
"category": "Docker",
"severity": "high"
},
"title": "Private keys stored in image",
"id": "425",
"description": "",
"type": "image",
"category": "Twistlock Labs",
"severity": "high",
"cause": "Found: /usr/share/npm/node_modules/agent-base/..."
},
... more compliance issues
]
}
```
## Configuring alert frequency
You can configure the rate at which alerts are emitted. This is a global setting that controls the spamminess of the alert service. Alerts received during the specified period are aggregated into a single alert. For each alert profile, an alert is sent as soon as the first matching event is received. All subsequent alerts are sent once per period.
1. Open Console, and go to **Manage > Alerts**.
2. In **General settings**, select the default frequency for all alerts.
You can specify the following frequencies.
* **10 Minutes**
* **1 Hour**
* **1 Day**.
## Sending alerts to a webhook
Alert profiles specify which events should trigger the alert machinery, and to which channel alerts are sent. You can send alerts to any combination of channels by creating multiple alert profiles.
Alert profiles consist of two parts:
**(1) Alert settings — Who should get the alerts, and on what channel?** Configure Prisma Cloud to integrate with your messaging service and specify the people or places where alerts should be sent. For example, configure the email channel and specify a list of all the email addresses where alerts should be sent. Or for JIRA, configure the project where the issue should be created, along with the type of issue, priority, assignee, and so on.
**(2) Alert triggers — Which events should trigger an alert to be sent?** Specify which of the rules that make up your overall policy should trigger alerts.
If you use multi-factor authentication, you must create an exception or app-specific password to allow Console to authenticate to the service.
## Create new alert channel
Create a new alert channel.
**Prerequisites:** You have a service to accept Prisma Cloud’s callback. For purely testing purposes, consider [PostBin](http://postb.in/) or [RequestBin](https://github.com/Runscope/requestbin#readme).
1. In **Manage > Alerts**, click **Add profile**.
2. Enter a name for your alert profile.
3. In **Provider**, select **Webhook**.
## Configure the channel
Configure the channel.
1. In **Webhook incoming URL**, enter the endpoint where Prisma Cloud should submit the alert.
2. In **Custom JSON**, Enter the structure of the JSON payload that your web application is expecting.
For more details about the type of data in each field, click **Show macros**.
3. (Optional) In **Credential**, specify a basic auth credential if your endpoint requires authentication.
4. (Optional) In **CA Certificate**, enter a CA cert in PEM format.
When using a CA certificate for secure communication, only one-way SSL authentication is supported. If two-way SSL authentication is configured, alerts will not be sent.
5. Click **Send Test Alert** to test the connection. An alert is sent immediately.
## Configure the triggers
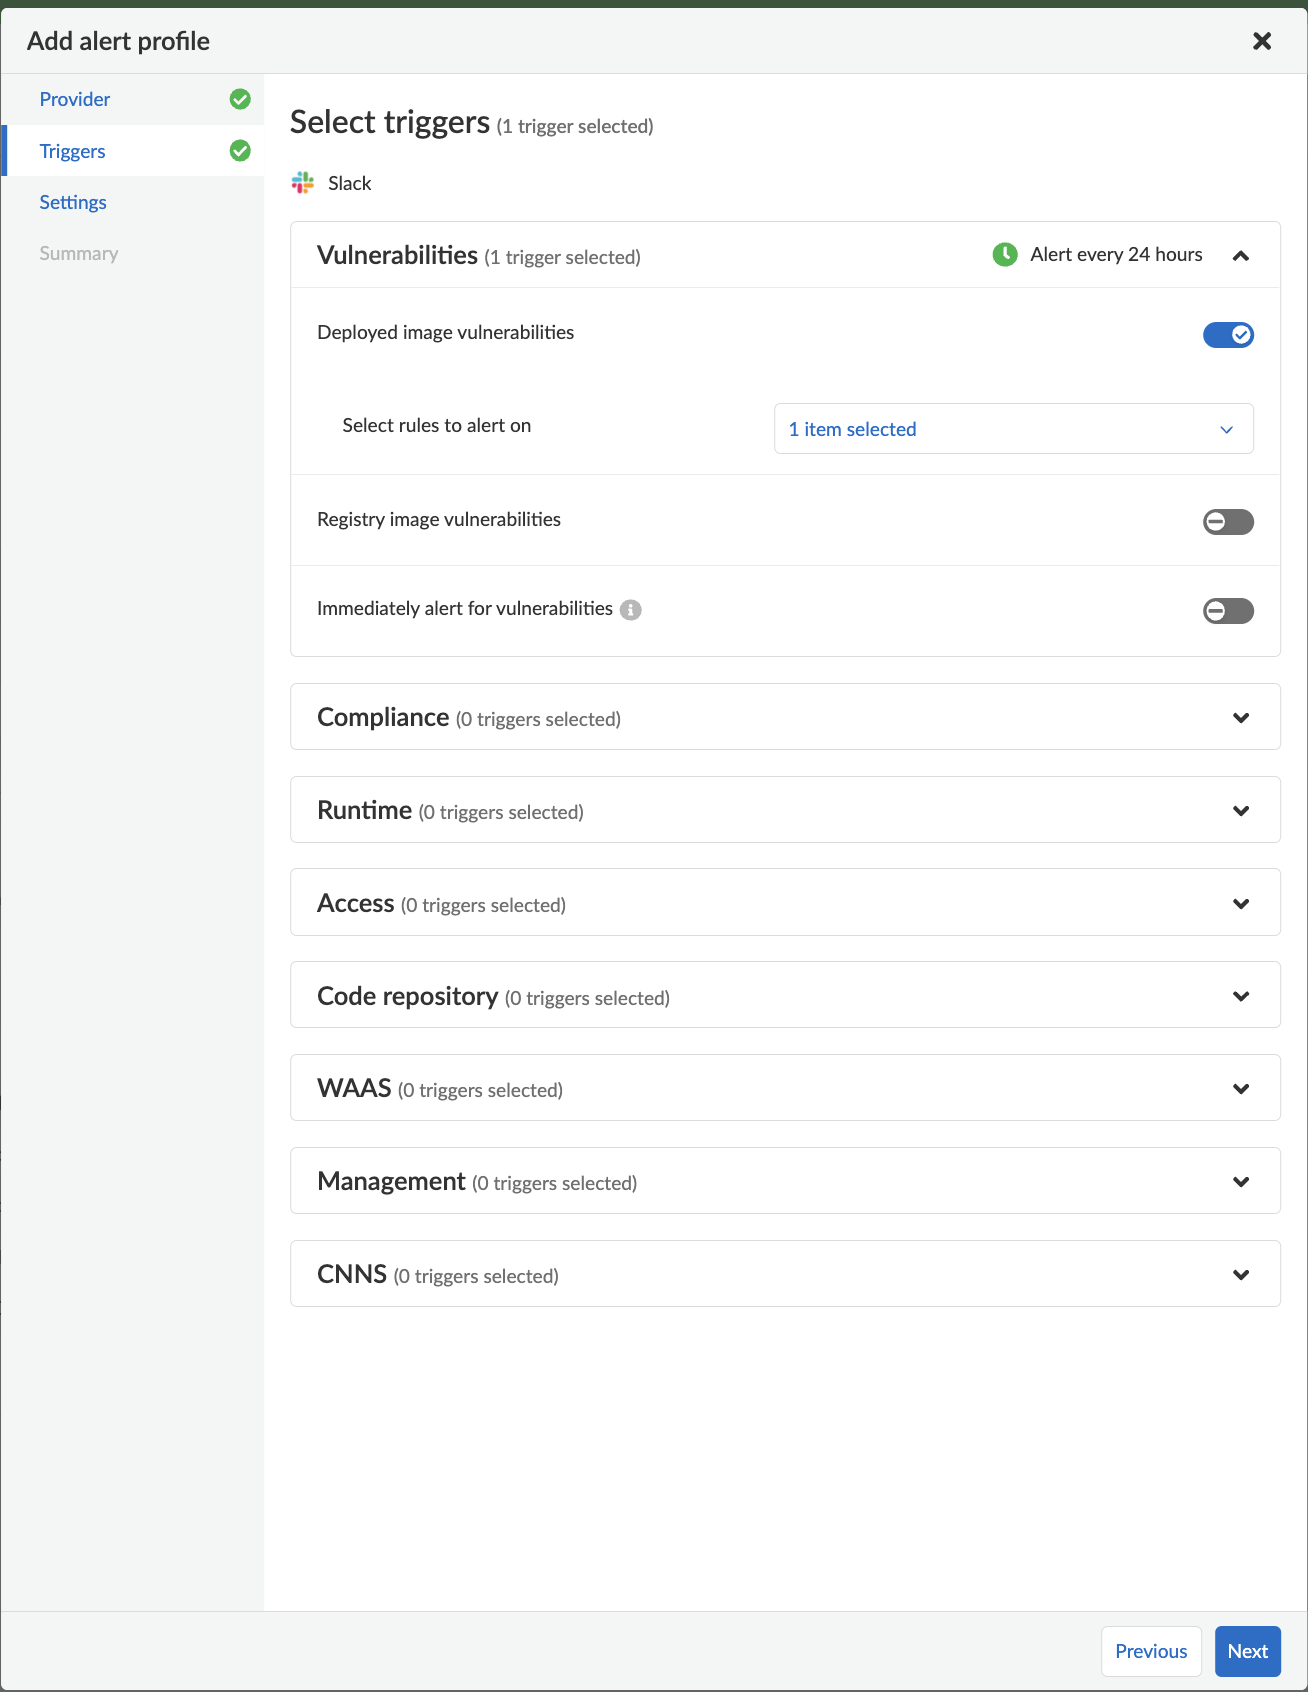
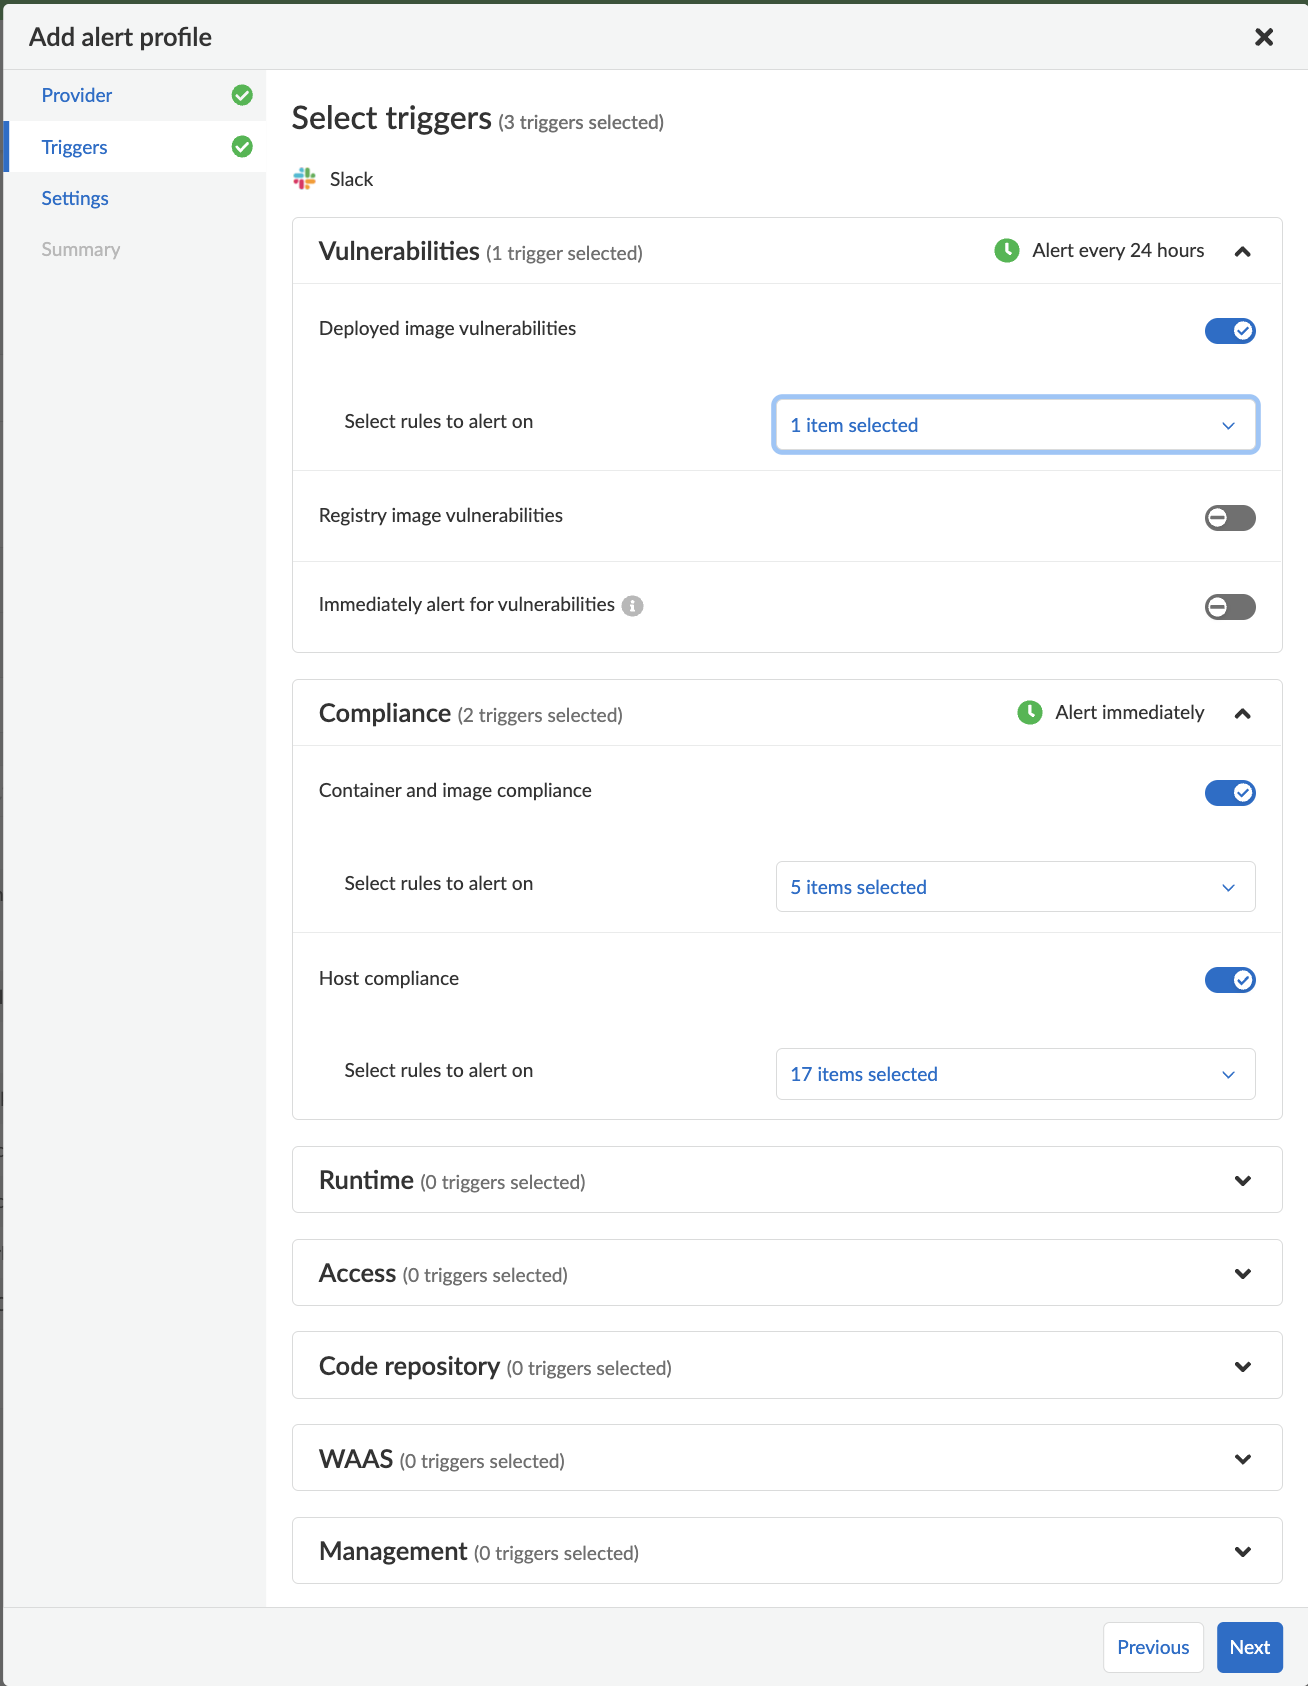
1. In **Select triggers**, select the events that should trigger an alert to be sent.
2. To specify specific rules that should trigger an alert, deselect **All rules**, and then select any individual rules.
3. Click **Next**.
---
# Agent Instructions
This documentation is published with GitBook. GitBook is the documentation platform designed so that both humans and AI agents can read, navigate, and reason over technical content effectively. Learn more at gitbook.com.
## Querying This Documentation
If you need additional information that is not directly available in this page, you can query the documentation by asking a question.
Perform an HTTP GET request on the following URL with the `ask` and `goal` query parameters:
```
GET https://docs.prismacloud.io/admin-guide/32/alerts/webhook.md?ask=&goal=
```
`ask` is the immediate question: it should be specific, self-contained, and written in natural language.
`goal` is what the user is ultimately trying to achieve, the reason they need the answer. Sharing it helps GitBook give you a better, more relevant answer. A goal is most helpful when it describes the outcome the user wants rather than restating the question. For example, with `ask=how do I create an API token`, a goal like `automate deployments from our CI pipeline` lets GitBook tailor the answer to that use case.
The response will contain a direct answer to the question and relevant excerpts and sources from the documentation.
Use this mechanism when the answer is not explicitly present in the current page, you need clarification or additional context, or you want to retrieve related documentation sections.