> For the complete documentation index, see [llms.txt](https://docs.prismacloud.io/llms.txt). Markdown versions of documentation pages are available by appending `.md` to page URLs; this page is available as [Markdown](https://docs.prismacloud.io/admin-guide/33/audit/logging.md).
# Syslog and stdout integration
You can configure Prisma Cloud to send audit event records (audits) to syslog and/or stdout for Console and Defender based on whether you have Prisma Cloud Compute Edition or Prisma Cloud Enterprise Edition.
## Sending syslog messages to a network endpoint
Writing to */dev/log* sends logs to the local host’s syslog daemon. The syslog daemon can then be optionally configured to forward those logs to a remote syslog or SIEM server. If you don’t have access to the underlying host, you can configure Prisma Cloud Console to send log messages directly to your remote system.
In most cases, you won’t need to specify a network endpoint in order to send syslog messages to your SIEM tool. If you already have log collectors on your hosts, simply enable syslog. Your log collectors will stream Prisma Cloud syslog messages to your SIEM tool.
Some things to keep in mind:
* Console sends logs directly to your remote server. When configuring Console with the remote server, validate that the address you enter is actually reachable from the host where Console runs. Otherwise, you risk losing log messages.
* Because Console sends messages directly to your remote server, and not through the local syslog daemon, you don’t get some of syslog’s built-in benefits, such as buffering, which protects against network outages and service failures.
* The classic syslog implementation sends logs over UDP. This is considered a bad practice if your logs have any value. UDP is connectionless. Packets are sent to their destination without confirming that they were received. TCP’s stateful connections and retransmission capabilities make it more appropriate for shuttling logs to a SIEM.
1. Log into Console.
2. Access **Manage > Alerts > Logging**.
3. Set **Syslog** to **Enabled**.
1. On **Send syslog messages to a network endpoint**, enter the string specifying a destination.
2. On **Enter the certificate for Syslog TLS**, upload the certificate in a PEM format. This certificate should be a root CA certificate, which will encrypt the syslog messages ensuring they are securely sent over HTTPS.
## Appending custom strings to syslog messages
Custom strings are set in the event message as a key-value pair, where the key is "id", and the value is your custom string. The following screenshot shows a Defender event, where the custom string is "koko".
Configuring a custom string is useful when you have multiple Prisma Cloud Compute deployments (i.e. multiple Compute Consoles) and you’re aggregating all messages in a single log management system. The custom string serves as a marker that lets you correlate specific events to specific deployments.
1. Open Console.
2. Go to **Manage > Alerts > Logging**.
3. Set **Syslog** to **Enabled**.
4. For **Identifier**, click **Edit**, and enter a string.
## Console events
Both Console and Defender emit messages. Console syslog messages are tagged as *Twistlock-Console* in the logs.
The data emitted to syslog and stdout is exactly the same.
### Console syslog event types
The following table describes each message type and sub-type.
| Syslog Type | Sub Type | Description |
| ----------------------------------- | ---------------------- | -------------------------------------------------------------------------------------- |
| image\_scan | — | This represents an image scan. |
| — | containerCompliance | This represents any Compliance findings within the image scan. |
| — | vulnerability | This represents any Vulnerability findings within the image scan. |
| container\_scan | — | This represents a Container scan. |
| — | container | This represents any Compliance findings within the container scan. |
| vm\_scan | — | This represents a VM scan. |
| — | containerCompliance | This represents any Compliance findings within the vm scan. |
| — | vulnerability | This represents any Vulnerability findings within the vm scan. |
| host\_scan | — | This represents a Host scan. |
| — | containerCompliance | This represents any Compliance findings within the host scan. |
| — | vulnerability | This represents any Vulnerability findings within the host scan. |
| scan\_summary | — | This represents a scan summary. The type of summary is dependent upon subtype below. |
| — | image | This represents a summary of image Vulnerability and Compliance issues. |
| — | container | This represents a summary of container Vulnerability and Compliance issues. |
| — | vm | This represents a summary of vm Vulnerability and Compliance issues. |
| — | host | This represents a summary of host Vulnerability and Compliance issues. |
| — | code\_repository\_scan | This represents a summary of code repository Vulnerability and Compliance issues. |
| — | registry\_scan | This represents a summary of registry Vulnerability and Compliance issues. |
| — | cloud\_scan | This represents a summary of cloud accounts with Compute Compliance issues. |
| management\_audit | — | This represents any management audit. This is broken out in the subtypes listed below. |
| — | login | This represents a login audit. |
| — | profile | This represents a profile state change audit. |
| — | settings | This represents a settings change audit. |
| — | rule | This represents a rule change audit. |
| — | user | This represents a user change audit. |
| — | group | This represents a group change audit. |
| — | credential | This represents a credential change audit. |
| — | tag | This represents a tag change audit. |
| kubernetes\_audit | — | This represents a Kubernetes audit. |
| admission\_audit | — | This represents an Admission Controller audit. |
| serverless\_runtime\_audit | — | This represents a Serverless runtime audit. |
| serverless\_app\_firewall\_audit | — | This represents a Serverless WAAS audit. |
| app\_embedded\_runtime\_audit | — | This represents an app embedded runtime audit. |
| app\_embedded\_app\_firewall\_audit | — | This represents an app embedded WAAS audit. |
| defender\_disconnected | — | This represents when a Defender is disconnected. |
### Image scan
Records when Prisma Cloud scans an image.
Example image scan message:
```
Jul 30 18:51:32 user-root Twistlock-Console[1]:
time="2019-07-30T18:51:32.214136319Z"
type="scan_summary"
log_type="image"
image_id="sha256:cd14cecfdb3a657ba7d05bea026e7ac8b9abafc6e5c66253ab327c7211fa6281"
image_name="user/internal:tag5"
vulnerabilities="297"
compliance="1"
```
### Container scan
Records when Prisma Cloud scans a container.
Example container scan message:
```
Jul 30 22:06:15 user-root Twistlock-Console[1]:
time="2019-07-30T22:06:15.804842461Z"
type="container_scan"
log_type="container"
container_id="d29ac3222f430ccf6a7d730db5cec3363d4c608680de881e26e13f9011e36d13"
container_name="twistlock_console"
image_name="twistlock/private:console_19_07_353"
compliance="6"
```
### Host scan
Records when Prisma Cloud scans a host. Defenders scan the hosts they run on.
Example host scan:
```console
Jul 30 22:09:53 user-root Twistlock-Console[1]:
time="2019-07-30T22:09:53.390680962Z"
type="scan_summary"
log_type="host"
hostname="user-root.c.cto-sandbox.internal"
vulnerabilities="89"
compliance="17"
```
### Code repository scan
Records when Prisma Cloud scans a code repository.
Example scan:
```console
Jul 7 23:34:09 ip-172-31-55-106 Twistlock-Console[1]:
time="2020-07-07T23:34:09.25109843Z"
type="scan_summary"
last_update_time="2020-07-07 23:21:00.203 +0000 UTC"
log_type="code_repository_scan"
source="github"
repository_name="jerryso/apper"
vulnerable_files="1"
vulnerabilities="25"
collections="All"
```
### Admin activity
Changes to any settings (including previous and new values), changes to any rules (create, modify, or delete), and all logon activity (success and failure) are logged. For every event, both the user name and source IP are captured.
Example admin activity audit:
```console
Jul 30 21:58:16 user-root Twistlock-Console[1]:
time="2019-07-30T21:58:16.80522678Z"
type="management_audit"
log_type="login"
username="user"
source_ip="137.83.195.96"
api="/api/v1/authenticate"
status="successful login attempt"
```
## Defender events
Defender syslog messages are tagged as *Twistlock-Defender* in logs. The data emitted to syslog and stdout is exactly the same.
App-embedded, Serverless, and Windows Defenders do not support Syslog.
### Defender syslog event types
The following table describes each event type and sub-type.
| Syslog Type | Sub Type | Description |
| ------------------------------- | ---------- | ---------------------------------------------------------------------------------------------------------- |
| container\_runtime\_audit | — | This represents a Container Runtime Audit. Details of Audit type is listed as subtype below. |
| — | processes | This represents a Container process runtime audit. |
| — | network | This represents a Container network runtime audit. |
| — | filesystem | This represents a Container filesystem runtime audit. |
| host\_activity\_audit | — | This represents a Host activity audit. |
| host\_network\_firewall\_audit | — | This represents a Host WAAS audit. |
| container\_app\_firewall\_audit | | This represents a Container WAAS audit. |
| host\_runtime\_audit | — | This represents a Host Runtime Audit. Each audit type is listed as subtype below. |
| — | processes | This represents a Host process runtime audit. |
| — | network | This represents a Host network runtime audit. |
| — | kubernetes | This represents a Host Kubernetes runtime audit. |
| — | filesystem | This represents a Host filesystem runtime audit. |
| incident | — | This represents an Incident. Host and Container incidents are differentiated by "host" or "container\_id". |
### Container runtime audit
Activity that breaches your runtime rules or the automatically generated allow lists in your models generates audits. The *log\_type* field specifies the runtime sensor that detected the anomaly (filesystem, processes. syscalls, or network).
Example container runtime audit: The following process audit shows that busybox was unexpectedly launched, and an alert was raised.
```console
Jul 30 22:41:25 user-root Twistlock-Defender[13460]:
time="2019-07-30T22:41:25.448709847Z"
type="container_runtime_audit"
container_id="73c2e8267f9b80ea152403c36c377476d24e43e211bb098300a317b3d1c472e4"
container_name="/dreamy_rosalind" image_id="sha256:94e814e2efa8845d95b2112d54497fbad173e45121ce9255b93401392f538499"
image_name="ubuntu:18.04"
effect="alert"
msg="High rate of reg file access events, reporting aggregation started;
last event: /usr/lib/apt/methods/gpgv wrote a suspicious file to /tmp/apt.conf.2ZH7tP.
Command: /usr/lib/apt/methods/gpgv"
log_type="filesystem"
custom_labels="io.kubernetes.pod.namespace:default"
account_id="prisma-cloud-compute"
cluster="cluster1"
```
### Host runtime audit
Activity that breaches your runtime rules or the automatically generated allow lists in your host services models generates audits.
Example host runtime audit:
```console
Jul 30 22:47:12 user-root Twistlock-Defender[13460]:
time="2019-07-30T22:47:12.325487039Z"
type="host_runtime_audit"
service_name="ssh"
effect="alert"
msg="Outbound connection by /usr/lib/apt/methods/http to an unexpected port: 80 IP: 91.189.91.26. Low severity audit, event is automatically added to the runtime model"
log_type="network"
account_id="prisma-cloud-compute"
cluster="cluster1"
```
### Access audit
Docker commands run on hosts protected by Defender.
With user access events, you can determine who performed an action, and on which resource.
For example:
* \[Bruce] \[started container X] in the \[DEV environment] (allowed).
* \[Bruce] \[stopped container Y] in the \[PROD environment] (denied).
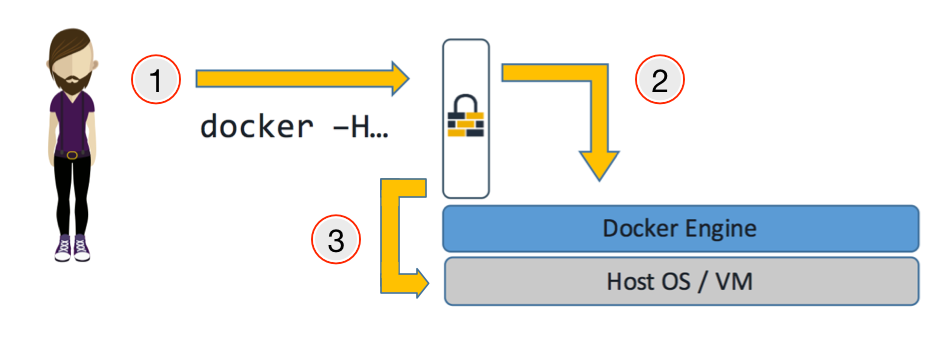
All Docker commands issued to the Docker daemon are intercepted and inspected by Defender to determine if they comply with the policy set in Console.
The following diagram illustrates how Defender operates on the management plane:
1. Bruce, a developer, issues a command, docker -H.
2. Defender checks the command against the policies defined in the Console. If the command is allowed, Defender forwards it to the Docker daemon for execution. If the command is denied, the user is notified.
3. An event is recorded in syslog.
Access audits have the following fields:
* type=access\_audit
* user=\[String] Identity of the person who ran the command
* action=\[String] Docker command requested - API invoked
* action\_type=\[String] Action type
* allow=\[Boolean] true/false - Action was allowed or not.
* rule=\[String] Rule matched
Example:
```console
Jul 30 23:02:23 user-root Twistlock-Defender[13460]:
time="2019-07-30T23:02:23.179494498Z"
type="access_audit"
user="user"
action="docker_ping"
action_type="docker"
allow="true"
rule="Default - allow all"
```
### App firewall audit (WAAS)
All events associated with WAAS (Web-Application and API Security) rules for container, hosts and app-embedded generate audits.
WAAS serverless events are not registered in the syslog. Events audits will be registered to the syslog in future releases.
WAAS Container and Host rule audits are written to the Defender host’s syslog. WAAS App-Embedded rule audits are written to the console’s host’s syslog.
Message fields for WAAS audit would change based on the deployment type as follows:
Container Deployment
* **container\_id=\[String]** Container id in which the event triggered
* **container\_name=\[String]** Container name on which the action was performed
* **image\_name=\[String]** Image name on which the action was performed
* **custom\_labels=\[String]** User-defined Alert Labels (**Mange > Alerts > Alert Labels**)
* **cluster=\[String]** Cluster name in which the event triggered
Host Deployment
* **hostname=\[String]** host in which the event triggered
* **cluster=\[String]** Cluster name in which the event triggered
App Embedded Deployment
* **app\_id=\[String]** app\_id in which the event triggered
All Deployments
* **time=\[String]** request timestamp
* **type=\[String]** type of app\_firewall\_audit
* **effect=\[String]** "alert", "prevent", "ban"
* **msg=\[String]** Audit message detailing the event
* **log\_type=\[String]** Attack Type
* **source\_ip=\[String]** source IP address from the request originated
* **source\_country=\[String]** country associated with source IP address
* **connecting\_ips=\[CSV]** list of IPs included in the *X-Forwarded-For* header
* **request\_method=\[String]** HTTP Request Method
* **request\_user\_agents=\[String]** user-agent string parsed from the `User-Agent` header
* **request\_host=\[String]** HTTP hostname in the request
* **request\_url=\[String]** request url
* **request\_path=\[String]** request path
* **request\_query=\[String]** request query string
* **request\_header\_names=\[String]** ordered list of HTTP request headers
* **response\_header\_names=\[String]** ordered list of HTTP response headers
* **status\_code=\[String]** HTTP response status code in the server response
In addition, message structure is subject for the following changes:
* Fields containing empty values are omitted from the message i.e. if a HTTP message does not contain a query field the request\_query field will not be present in the message.
* **connecting\_ips** - present only if `X-Forwarded-For` Header is present in the request.
* **status\_code** - present only for audits created for the "Track Server Error Response Codes" and "Detect Information Leakage" protections
* **response\_header\_names** - present only for audits created for the "Track Server Error Response Codes" and "Detect Information Leakage" protections.
* **source\_country** - present only if resolution was successful.
* **container\_name** - will be replaced by **host\_id** or **function\_id**
Example:
```console
Jul 16 20:10:16 cnaf-nightly-build Twistlock-Defender[1947]:
time="2020-07-16T20:10:16.706085135Z"
type="container_app_firewall_audit"
container_id="0a16b4e4dbefc6ef8cc6a08d038e775a8523ad053416730f01eafbf2dee2e693"
container_name="/nginx"
image_name="nginx:latest"
effect="prevent"
msg="Client exceeded violations within 1m. Banning client for 5m"
log_type="violations exceeded"
source_ip="12.34.56.78"
source_country="IL"
connecting_ips="11.22.33.44"
request_method="HEAD"
request_user_agents="curl/7.54.0"
request_host="www.example.com"
request_url="www.example.com/?id=../etc/passwd"
request_path="/"
request_query="id=../etc/passwd"
request_header_names="X-Forwarded-For,User-Agent,Accept"
response_header_names="Set-Cookie,Date,Content-Type,Content-Length X-Frame-Options"
status_code="404"
```
### Process activity audit
Records all processes spawned in a container.
Process audits are only recorded when **Detailed output of all runtime process activity** is enabled in **Manage > Alerts > Logging**.
Note that process activity that breaches your runtime policy is separately audited. For more information, see the container runtime audit section.
This audit has the following fields:
* type=process
* pid=Process ID
* path=Path to the executable in the container file system
* interactive=Whether the process was spawned from a shell session: true or false
* container-id=Container ID
Example: This audit shows that busybox was spawned in the container with ID 8c5b3fe0037d.
```console
Jul 30 22:06:03 user-root Twistlock-Defender[13460]:
time="2019-07-30T22:06:03.515319204Z"
type="process"
pid="20859"
path="/bin/df"
interactive="false"
container_id="3491b03544a51c60e176e54a5077161f14dbc850bf069cf7a096db028e9981de"
```
### Incidents
Incidents are logical groupings of events, related by context, that reveal known attack patterns.
Example container incident:
```console
Jul 30 22:41:24 user-root Twistlock-Defender[13460]:
time="2019-07-30T22:41:24.987209676Z"
type="incident"
container_id="73c2e8267f9b80ea152403c36c377476d24e43e211bb098300a317b3d1c472e4"
image_name="ubuntu:18.04"
host="user-root.c.cto-sandbox.internal"
incident_category="hijackedProcess"
custom_labels="io.kubernetes.pod.namespace:default"
account_id="prisma-cloud-compute"
cluster="cluster1"
```
Example host incident:
```console
Mar 5 00:26:42 user-root Twistlock-Defender[22797]:
time="2018-03-05T00:26:42.894707831+02:00"
type="incident"
service_name="http-service"
host="user-root"
incident_category="serviceViolation"
audit_ids="5a9c72a223d020590de74db5"
account_id="prisma-cloud-compute"
cluster="cluster1"
```
## Rate limiters
Depending on your configuration, Prisma Cloud can produce a lot of logs, especially in environments with many hosts, images, and containers. By default, most syslog daemons throttle logging with a rate limiter.
If you have a large environment (hundreds of Defenders with tens of images per host) AND you have configured Prisma Cloud for verbose syslog output, you will need to tune the rate limiter. Otherwise, you might find that logs are missing.
For example, on RHEL 7, you must tune both systemd-journald’s `RateLimitInterval` and `RateLimitBurst` settings and rsyslog’s `imjournalRatelimitInterval` and `imjournalRatelimitBurst` settings. For more information about RedHat settings, see [How to disable log rate-limiting in Red Hat Enterprise Linux 7](https://access.redhat.com/solutions/1417483).
## Truncated log messages
Very long syslog events can get truncated. For example, changing settings in Console generates management\_audits events, which show a diff between old settings and new settings. For policies changes, the diff can be big. Linux log managers limit the number of characters logged per line, and so long messages, such as management audits, can be truncated.
If you’ve got truncated log messages, increase the log manager’s default string size limit. There are several types log managers, but rsyslog is popular with most distributions. For rsyslog, the default log string size is 1024 characters per line. To increase it, open */etc/rsyslog.conf* and set the maximum message size:
```console
$MaxMessageSize 20k
```
---
# Agent Instructions
This documentation is published with GitBook. GitBook is the documentation platform designed so that both humans and AI agents can read, navigate, and reason over technical content effectively. Learn more at gitbook.com.
## Querying This Documentation
If you need additional information that is not directly available in this page, you can query the documentation by asking a question.
Perform an HTTP GET request on the following URL with the `ask` and `goal` query parameters:
```
GET https://docs.prismacloud.io/admin-guide/33/audit/logging.md?ask=&goal=
```
`ask` is the immediate question: it should be specific, self-contained, and written in natural language.
`goal` is what the user is ultimately trying to achieve, the reason they need the answer. Sharing it helps GitBook give you a better, more relevant answer. A goal is most helpful when it describes the outcome the user wants rather than restating the question. For example, with `ask=how do I create an API token`, a goal like `automate deployments from our CI pipeline` lets GitBook tailor the answer to that use case.
The response will contain a direct answer to the question and relevant excerpts and sources from the documentation.
Use this mechanism when the answer is not explicitly present in the current page, you need clarification or additional context, or you want to retrieve related documentation sections.