> For the complete documentation index, see [llms.txt](https://docs.prismacloud.io/llms.txt). Markdown versions of documentation pages are available by appending `.md` to page URLs; this page is available as [Markdown](https://docs.prismacloud.io/admin-guide/33/runtime-defense/runtime-defense-aggregation.md).
# Event Aggregation
When multiple events of the same type occur in quick succession, Prisma Cloud implements event aggregation to prevent the console from displaying the same audits repetitively.
## Conditions for Event Aggregation
Event aggregation starts when the following conditions are met:
* Events are generated on the same resource, such as a specific image on a host.
* Events fall within the same "event type" category.
## Event Aggregation Process
The event aggregation process depends on the following criteria:
* Grace period: A period during which no events are displayed or counted towards aggregation. In Prisma Cloud, it is a 15-minute period without audits since the last event.
* Throttle period: A waiting period before setting the aggregation mode. It is the time within which events must occur to qualify for aggregation. In Prisma Cloud, the throttle period is 15 minutes.
* Aggregation mode: A state activated when specific criteria are met: the grace period of 15 minutes is complete and then 5 qualifying events occur within the throttle period of 15 minutes. In aggregation mode, the Defender combines multiple events into a single aggregated event. This reduces repetitive displays of similar audits.
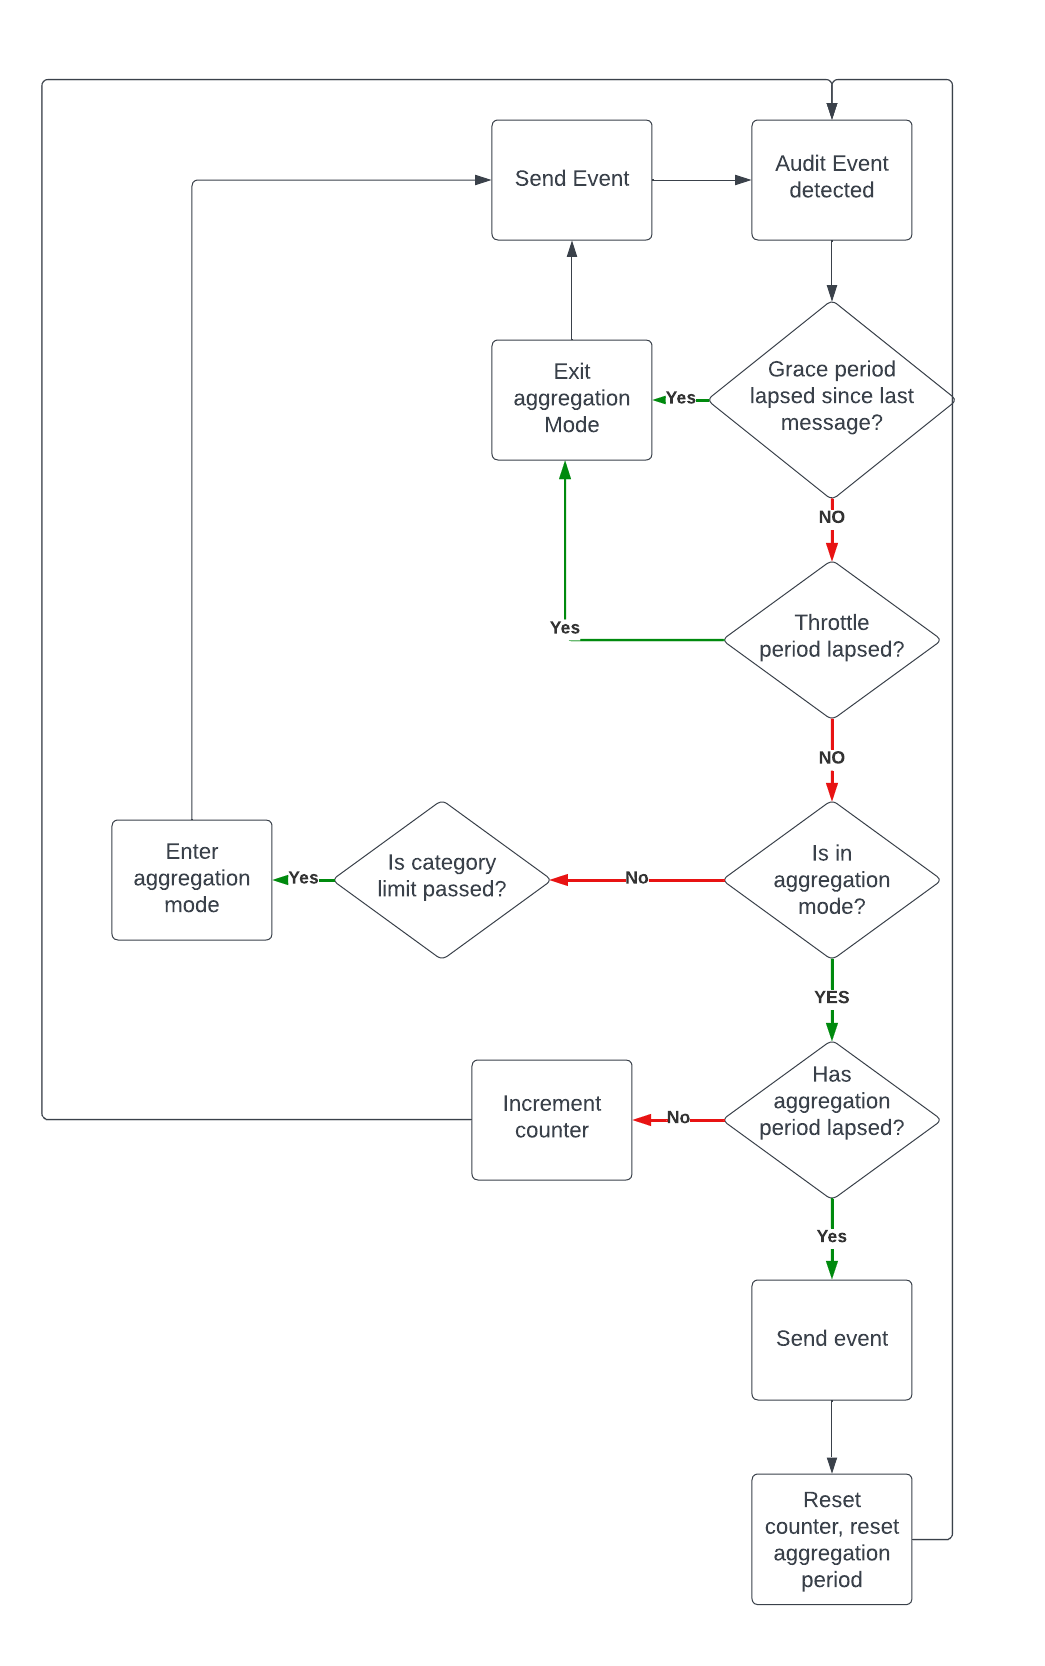
**Prisma Cloud Event Aggregation Process**
1. Event monitoring: Defender monitors for audit events.
2. Grace period and throttle period check:
* After event detection, Defender checks whether a 15-minute grace period (without audits) has passed since the last event.
* After the grace period is completed, Defender assesses whether the throttle period (set to 15 minutes) has elapsed since the first event. Throttle period is the waiting period before setting the aggregation mode.
* If both the grace period and throttle period conditions are not met, Defender waits for additional events.
3. Activation of aggregation mode:
* On meeting the criteria (the grace period of 15 minutes is complete and then 5 qualifying events occur within the throttle period of 15 minutes), Defender activates the aggregation mode.
* It verifies whether the aggregation period, set to 10 minutes, has passed since the last aggregation.
* If the aggregation period has not passed, Defender waits for more events.
4. Display of Aggregated Events:
* After all criteria are met, including compliance with the category limit, Defender sends the aggregated event to the console.
5. Resumption of Normal Operation:
* Normal operation resumes when the grace period expires without new messages or when the throttle period lapses from the first event.
* Defender resets the counter, establishes the aggregation period again, and resumes monitoring for audit events.
This process is illustrated using the following flowchart:
## Displaying Audit Information
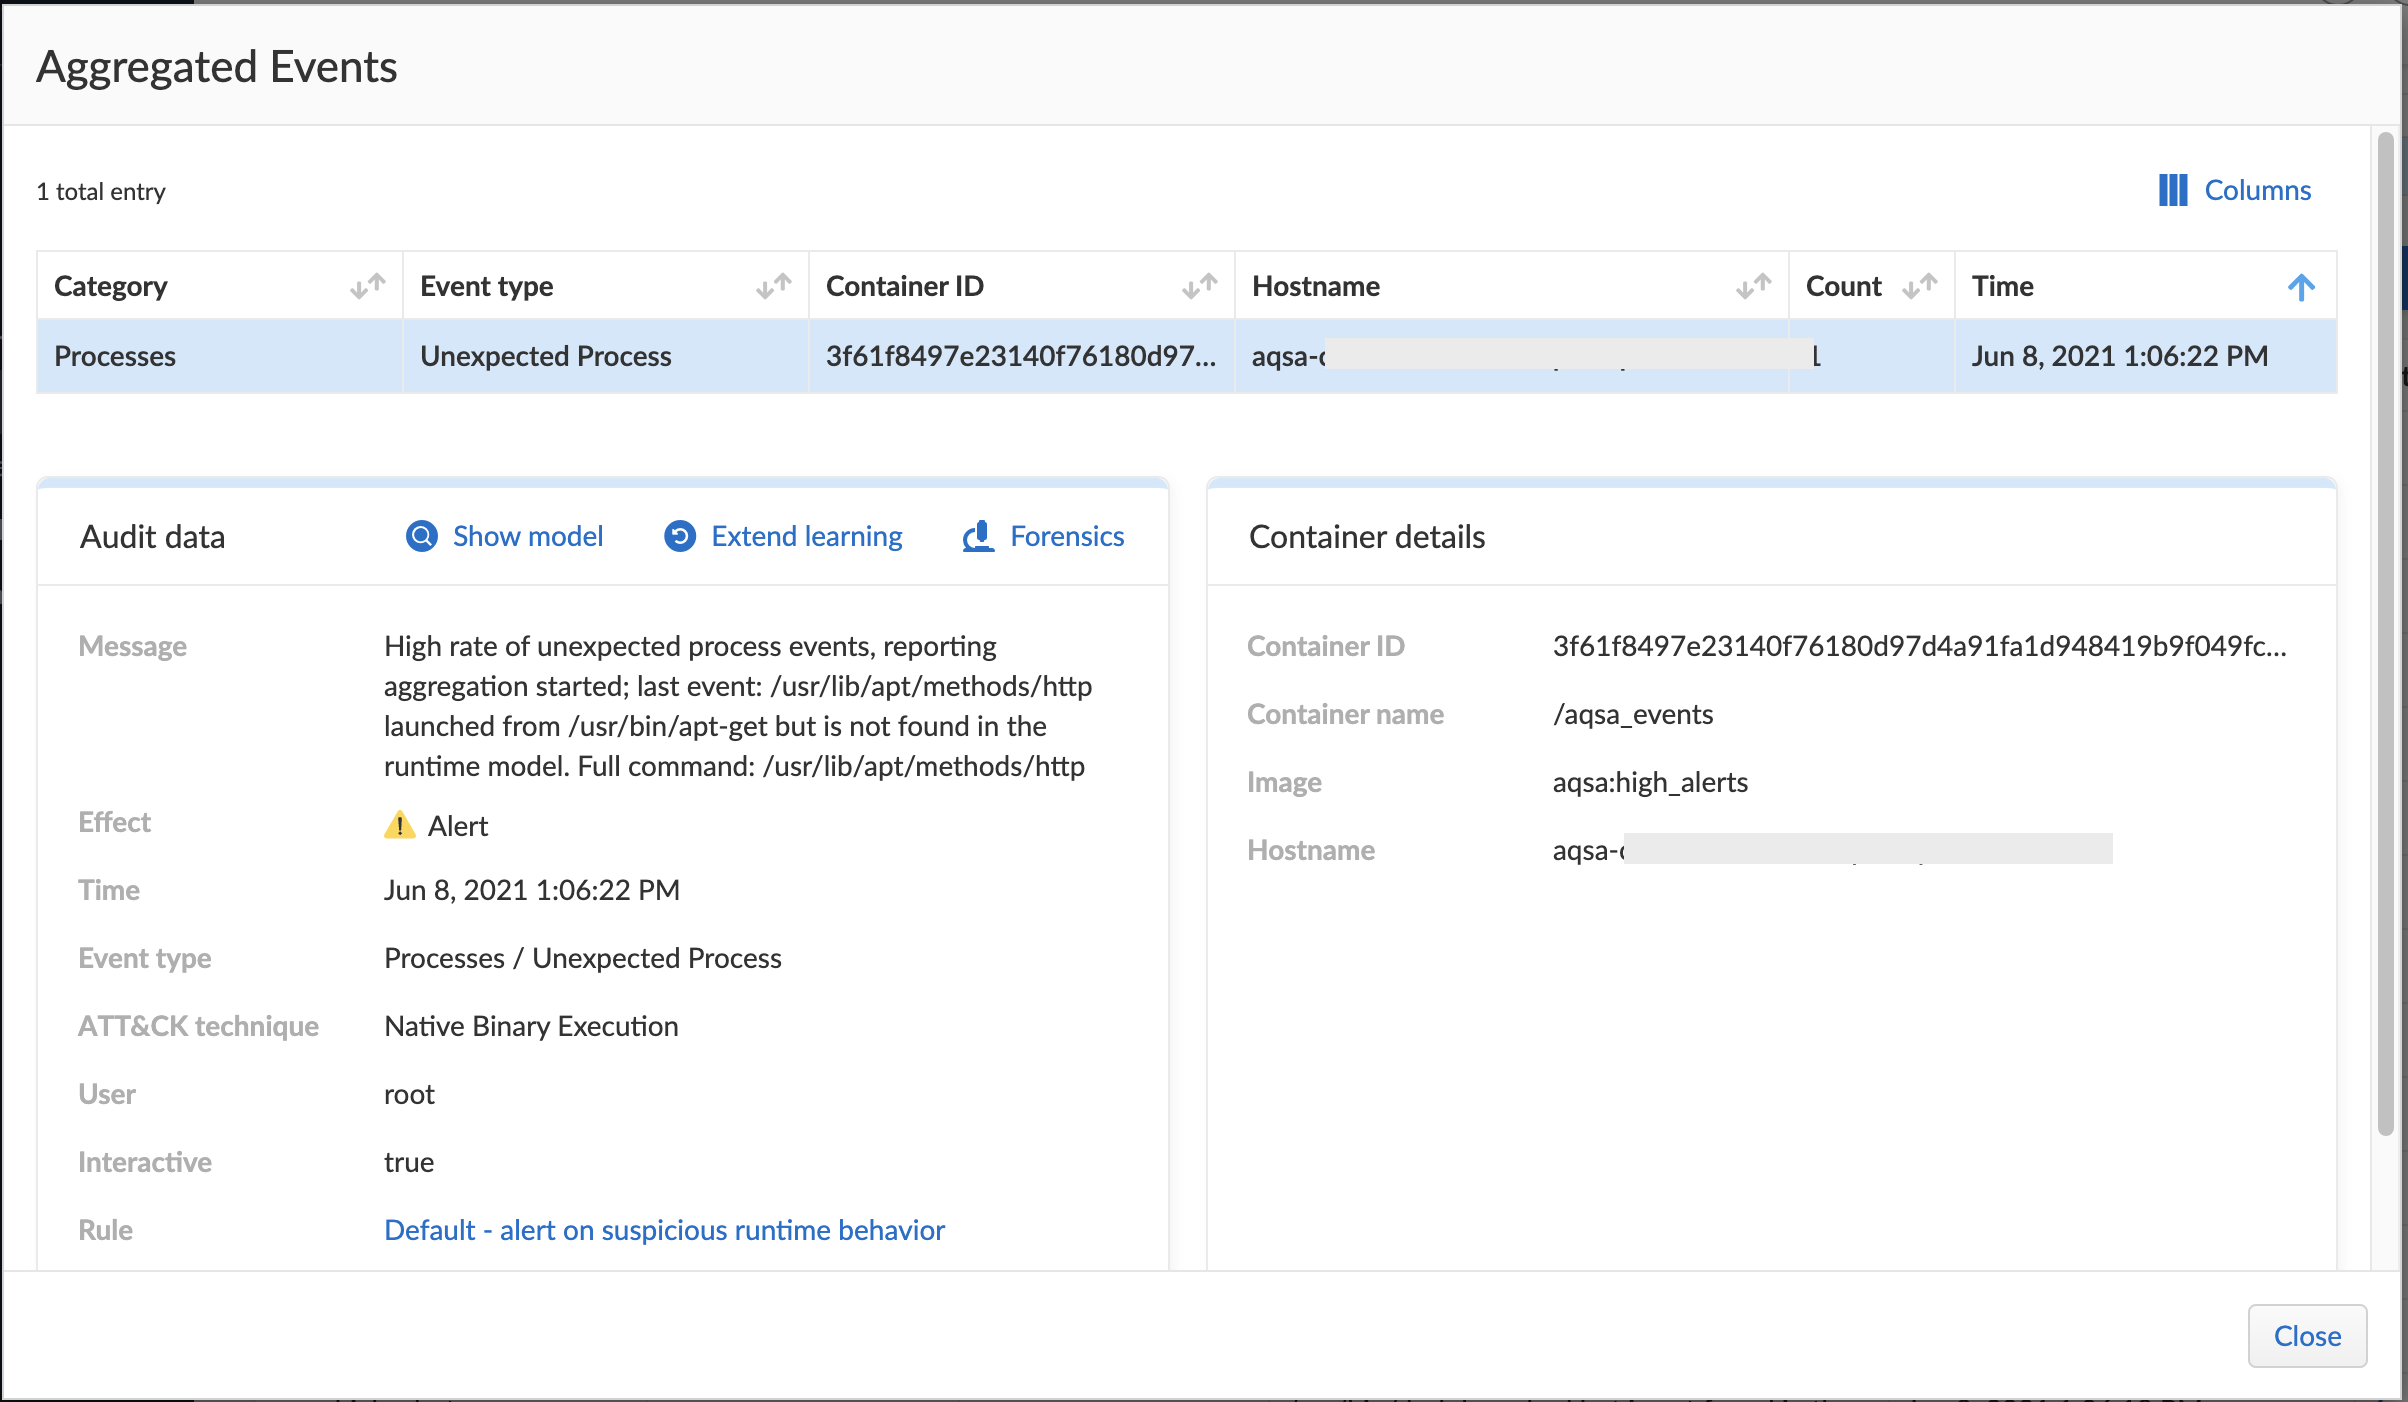
Prisma Cloud displays the summarized audit information in the following format: `The most recent individual audit, along with the aggregated message count.`
For example:
`High rate of , reporting aggregation started; Last event: launched from but is not found in the runtime model. In the past 10 minutes, container had of .`
---
# Agent Instructions
This documentation is published with GitBook. GitBook is the documentation platform designed so that both humans and AI agents can read, navigate, and reason over technical content effectively. Learn more at gitbook.com.
## Querying This Documentation
If you need additional information that is not directly available in this page, you can query the documentation by asking a question.
Perform an HTTP GET request on the following URL with the `ask` and `goal` query parameters:
```
GET https://docs.prismacloud.io/admin-guide/33/runtime-defense/runtime-defense-aggregation.md?ask=&goal=
```
`ask` is the immediate question: it should be specific, self-contained, and written in natural language.
`goal` is what the user is ultimately trying to achieve, the reason they need the answer. Sharing it helps GitBook give you a better, more relevant answer. A goal is most helpful when it describes the outcome the user wants rather than restating the question. For example, with `ask=how do I create an API token`, a goal like `automate deployments from our CI pipeline` lets GitBook tailor the answer to that use case.
The response will contain a direct answer to the question and relevant excerpts and sources from the documentation.
Use this mechanism when the answer is not explicitly present in the current page, you need clarification or additional context, or you want to retrieve related documentation sections.