> For the complete documentation index, see [llms.txt](https://docs.prismacloud.io/llms.txt). Markdown versions of documentation pages are available by appending `.md` to page URLs; this page is available as [Markdown](https://docs.prismacloud.io/admin-guide/33/technology-overviews/radar.md).
# Radar
Radar is the primary interface for monitoring your environment. Radar enables you to identify and block known and unknown traffic moving laterally through your environment.
Radar is the default view when you first log into the console. Radar helps you visualize and navigate through all the data across Prisma Cloud. For example, On the Radar canvas, you can visualize the connectivity between microservices, instantly drill into the per-layer vulnerability analysis tool, assess compliance, and investigate the incidents.
Radar makes it easy to conceptualize the architecture and connectivity of large environments, identify risks, and zoom in on incidents that require a response. Radar provides a visual depiction of inter-network and intra-network connections between containers, apps, and cluster services across your environment. It shows the ports associated with each connection, the direction of traffic flow, and internet accessibility. When Cloud Native Network Segmentation (CNNS) is enabled, Prisma Cloud automatically generates the mesh shown in Radar based on what it has learned about your environment.
Radar’s pivot has a container view, a host view, and a serverless view. In the container view, each image with running containers is depicted as a node in the graph. In the host view, each host machine is depicted as a node in the graph. As you select a node, an overlay shows vulnerability, compliance, and runtime issues. The serverless view in Radar, visualize and inspect the attack surface of the serverless functions.
Radar refreshes its view every 24 hours. The Refresh button has a red marker when new data is available to be displayed. To get full visibility into your environment, install a Defender on every host in your environment.
Radar does not monitor or control traffic between Azure resources and services.
## Cloud Pivot
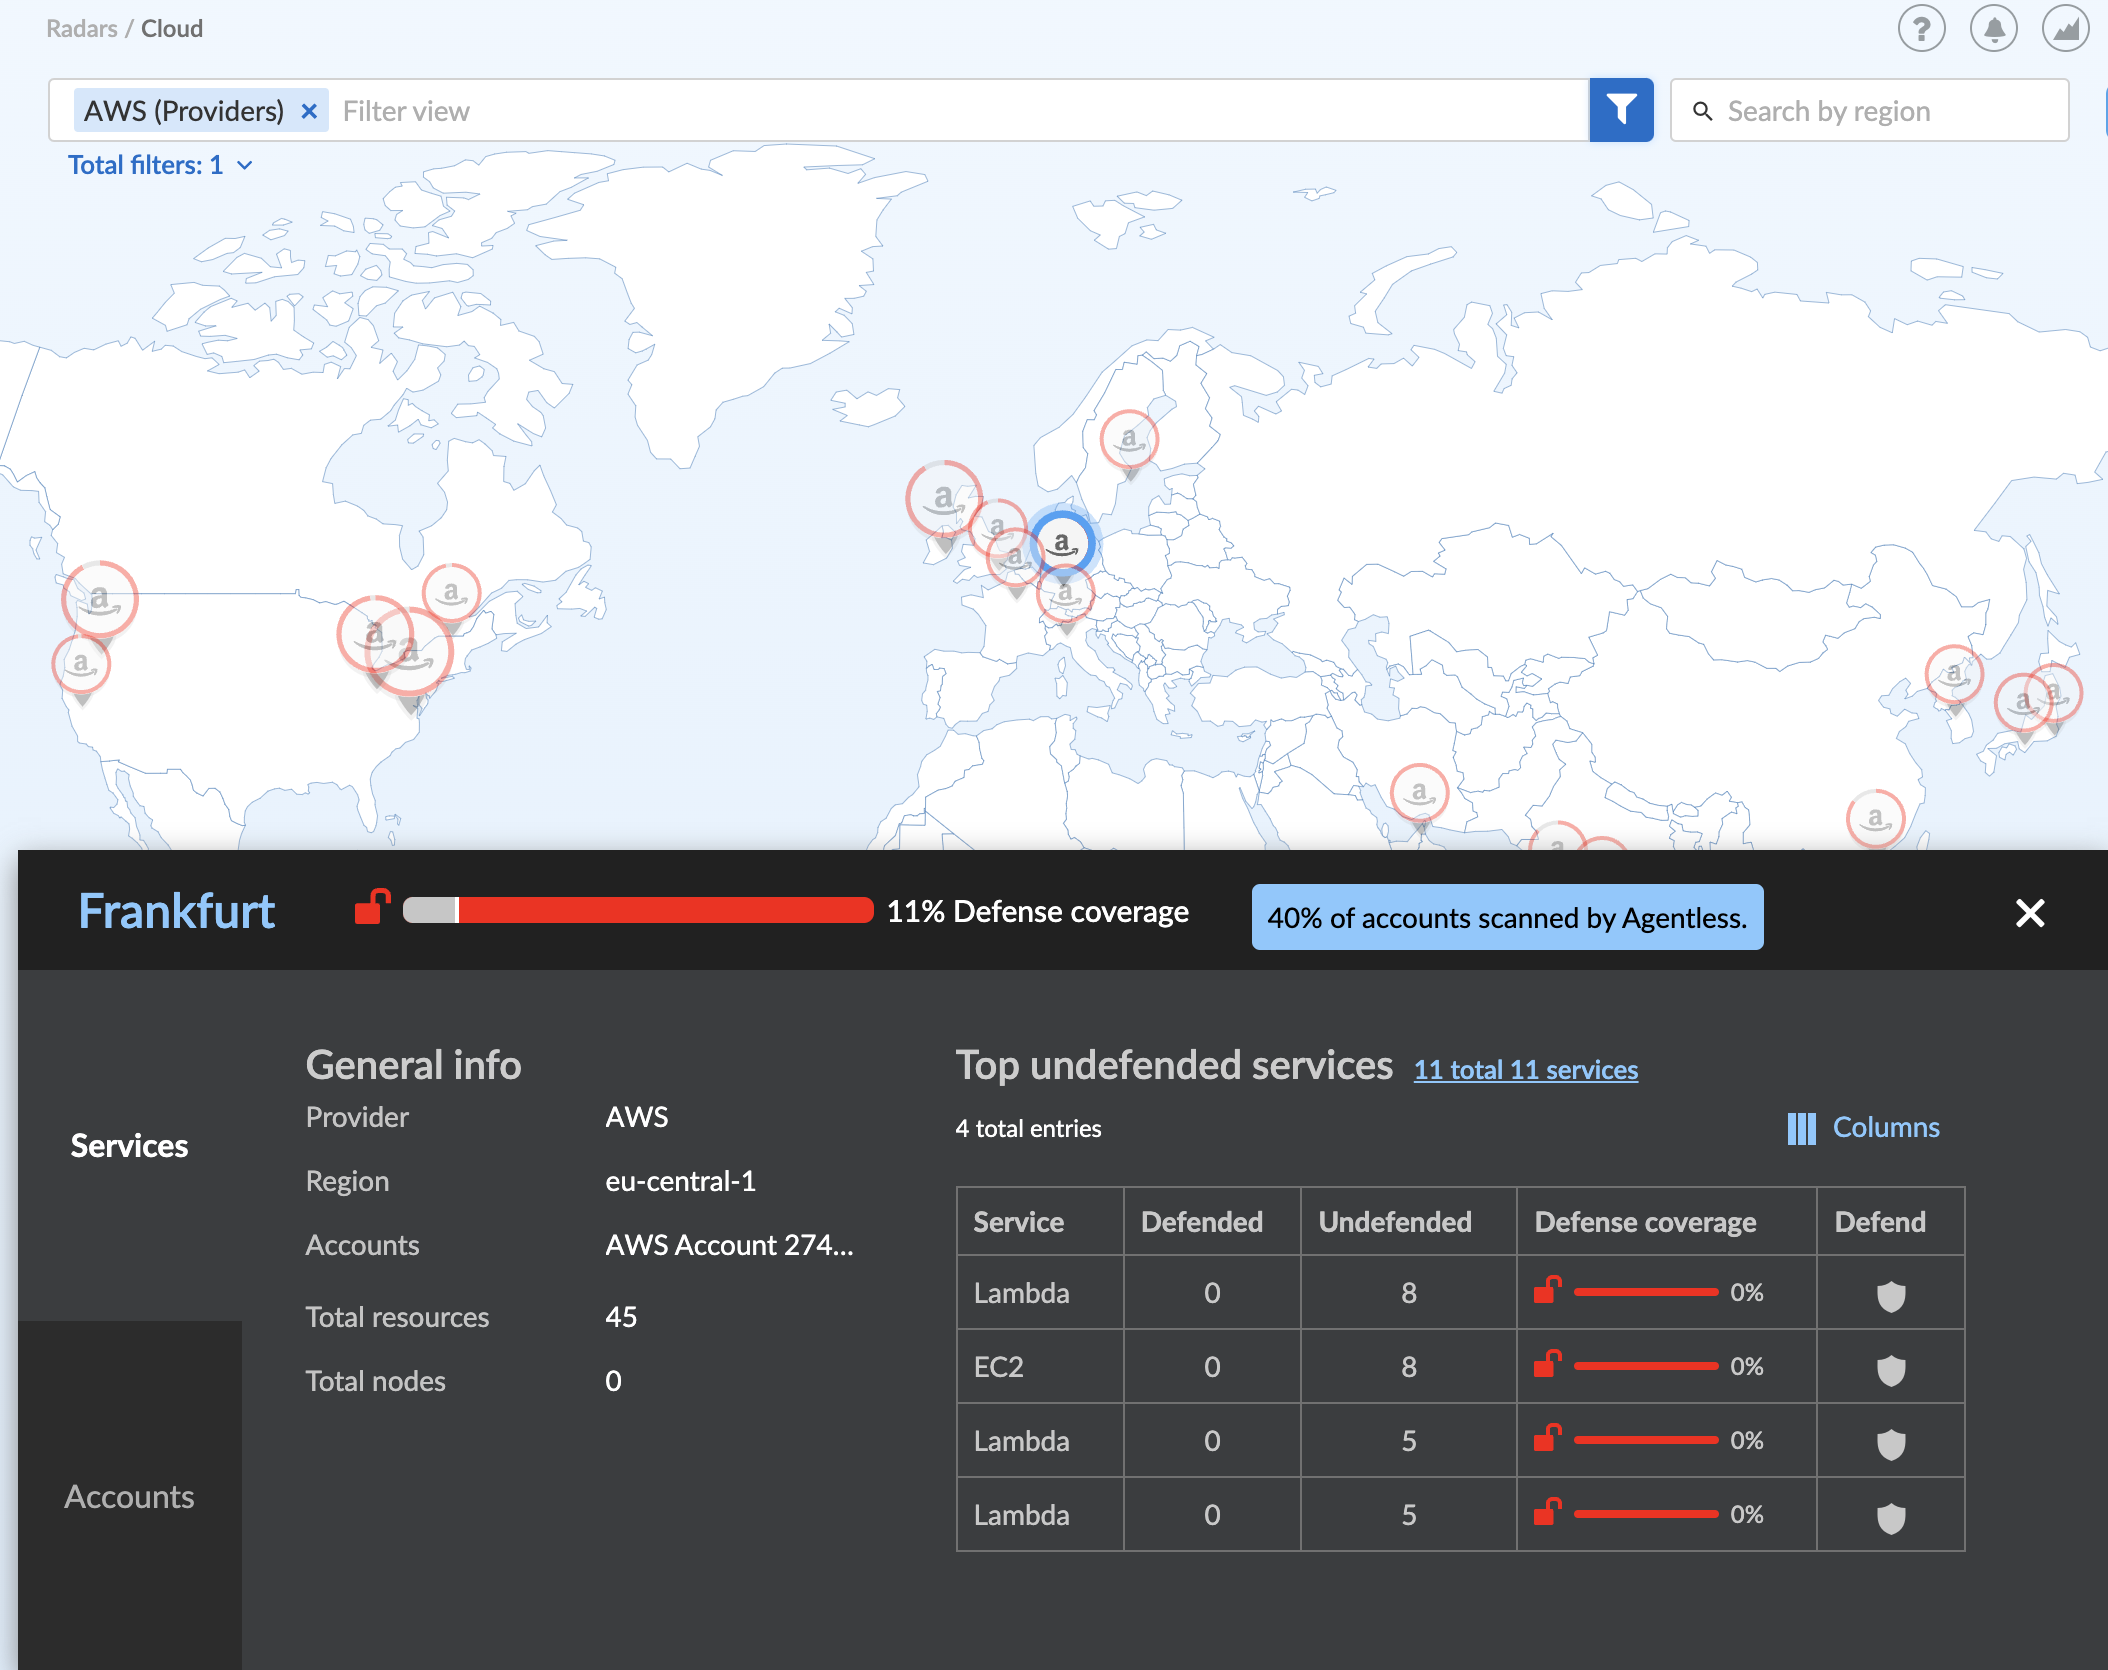
You can’t secure what you don’t know about. Prisma Cloud discovery finds all cloud-native services deployed in AWS, Azure, and Google Cloud. It helps you visualize what you’ve deployed across different cloud providers and accounts using a map interface. The map tells you what services are running in which data centers, which services are protected by Prisma Cloud, and their security posture.
Select a marker on the map to see details about the services deployed in the account/region. You can directly secure both the registries and the serverless functions by selecting **Defend** next to them.
You can filter the data based on an entity to narrow down your search. For example, filters can narrow your view to just the serverless functions in your AWS development team accounts.
By default, there’s no data in Cloud Radar.
### Image pivot
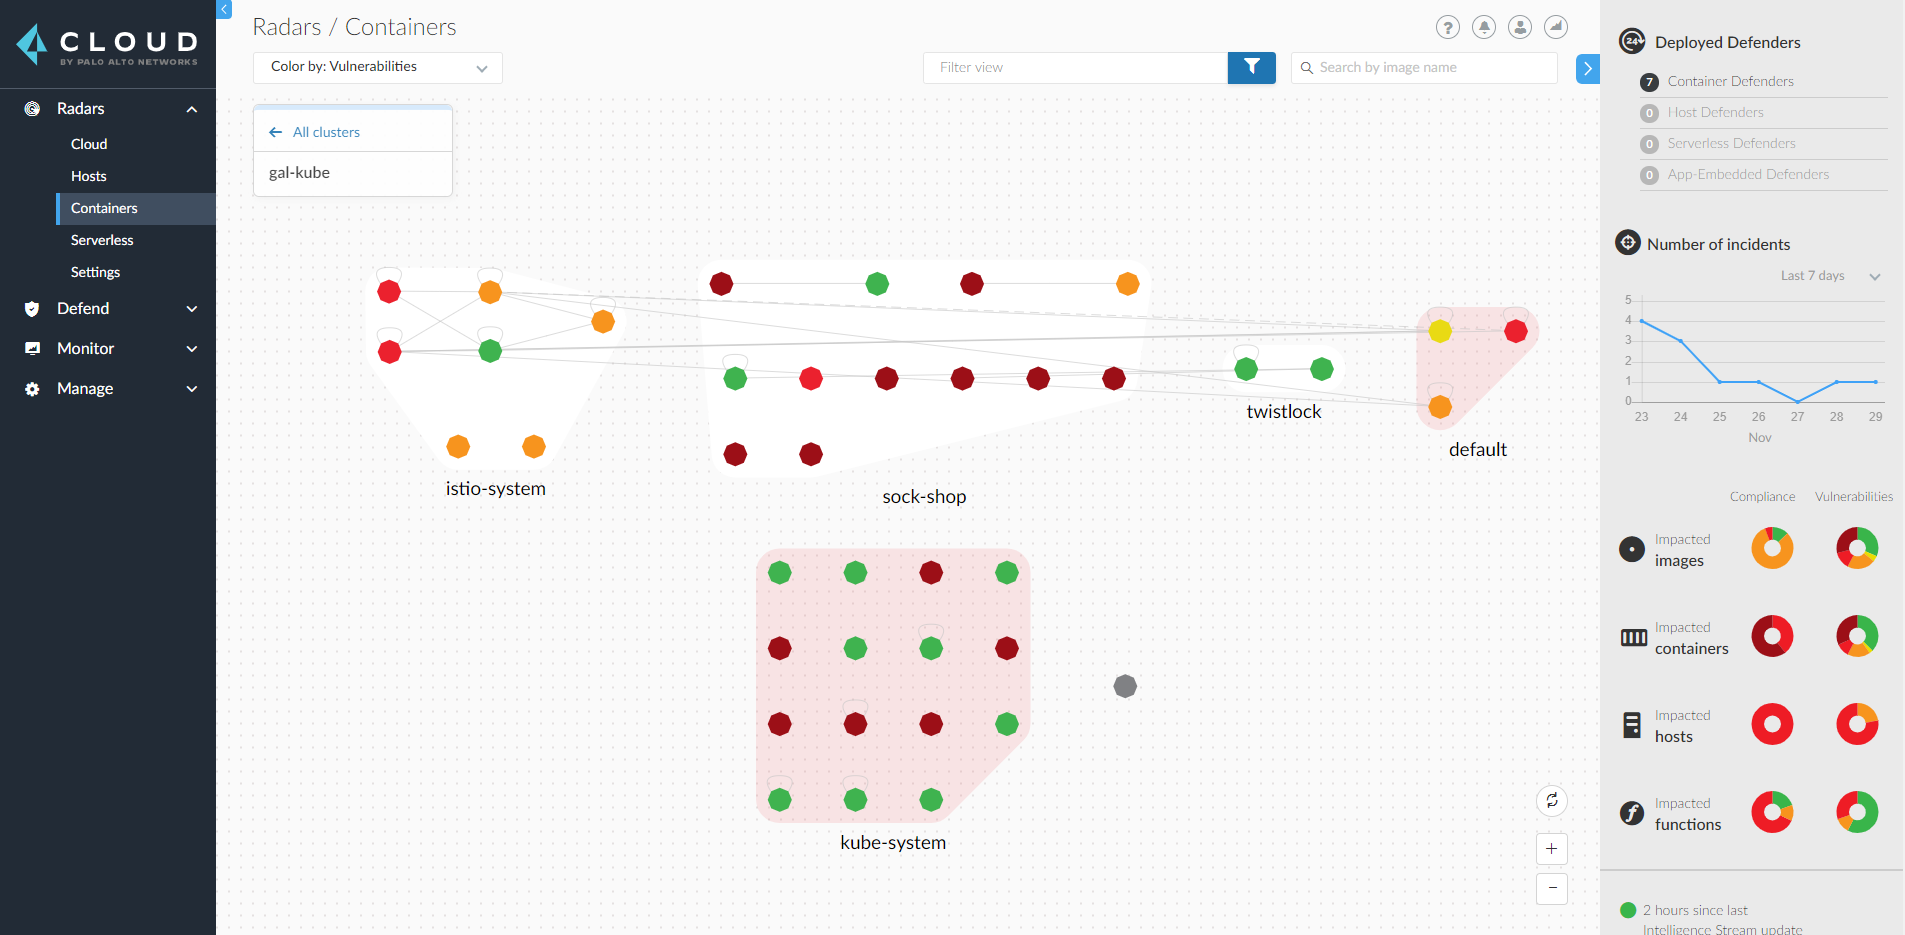
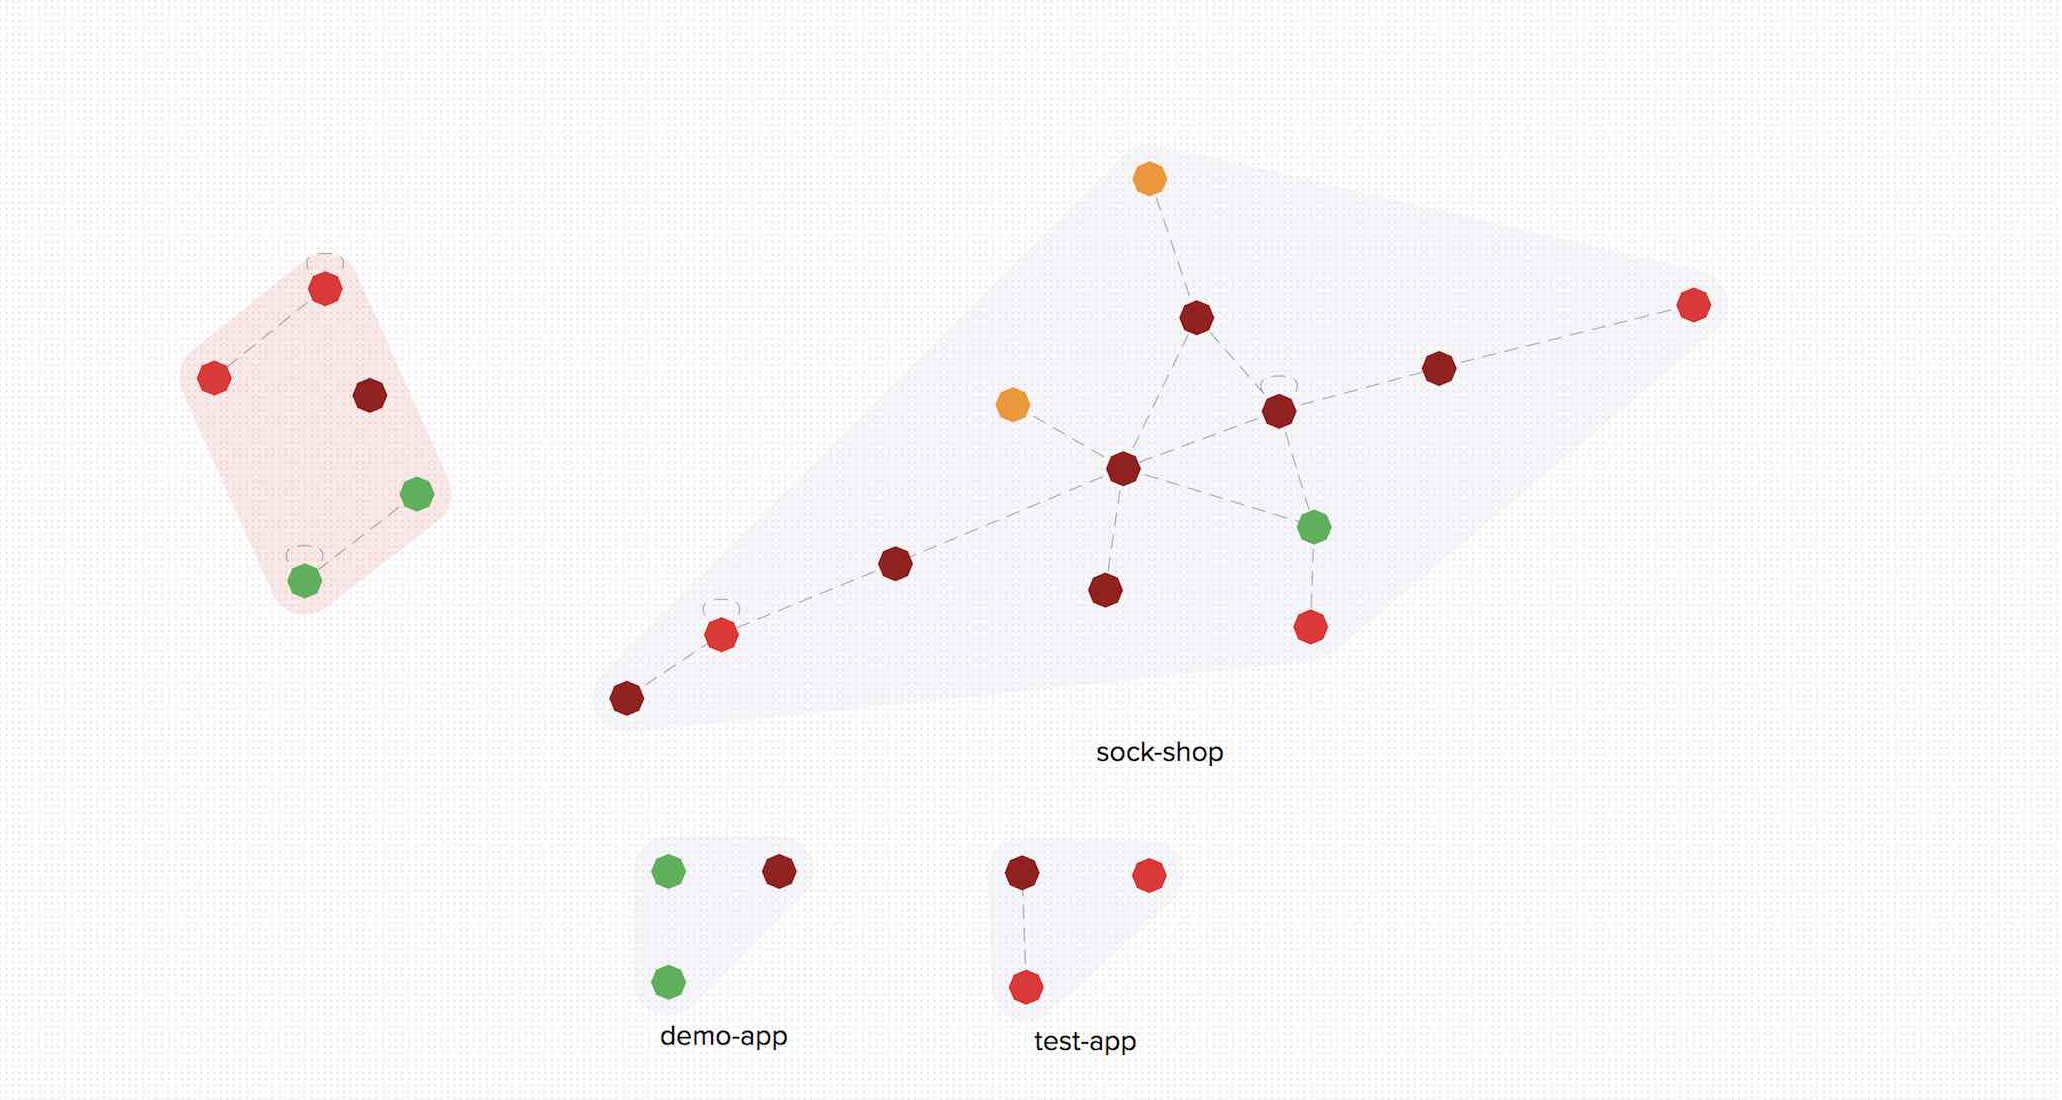
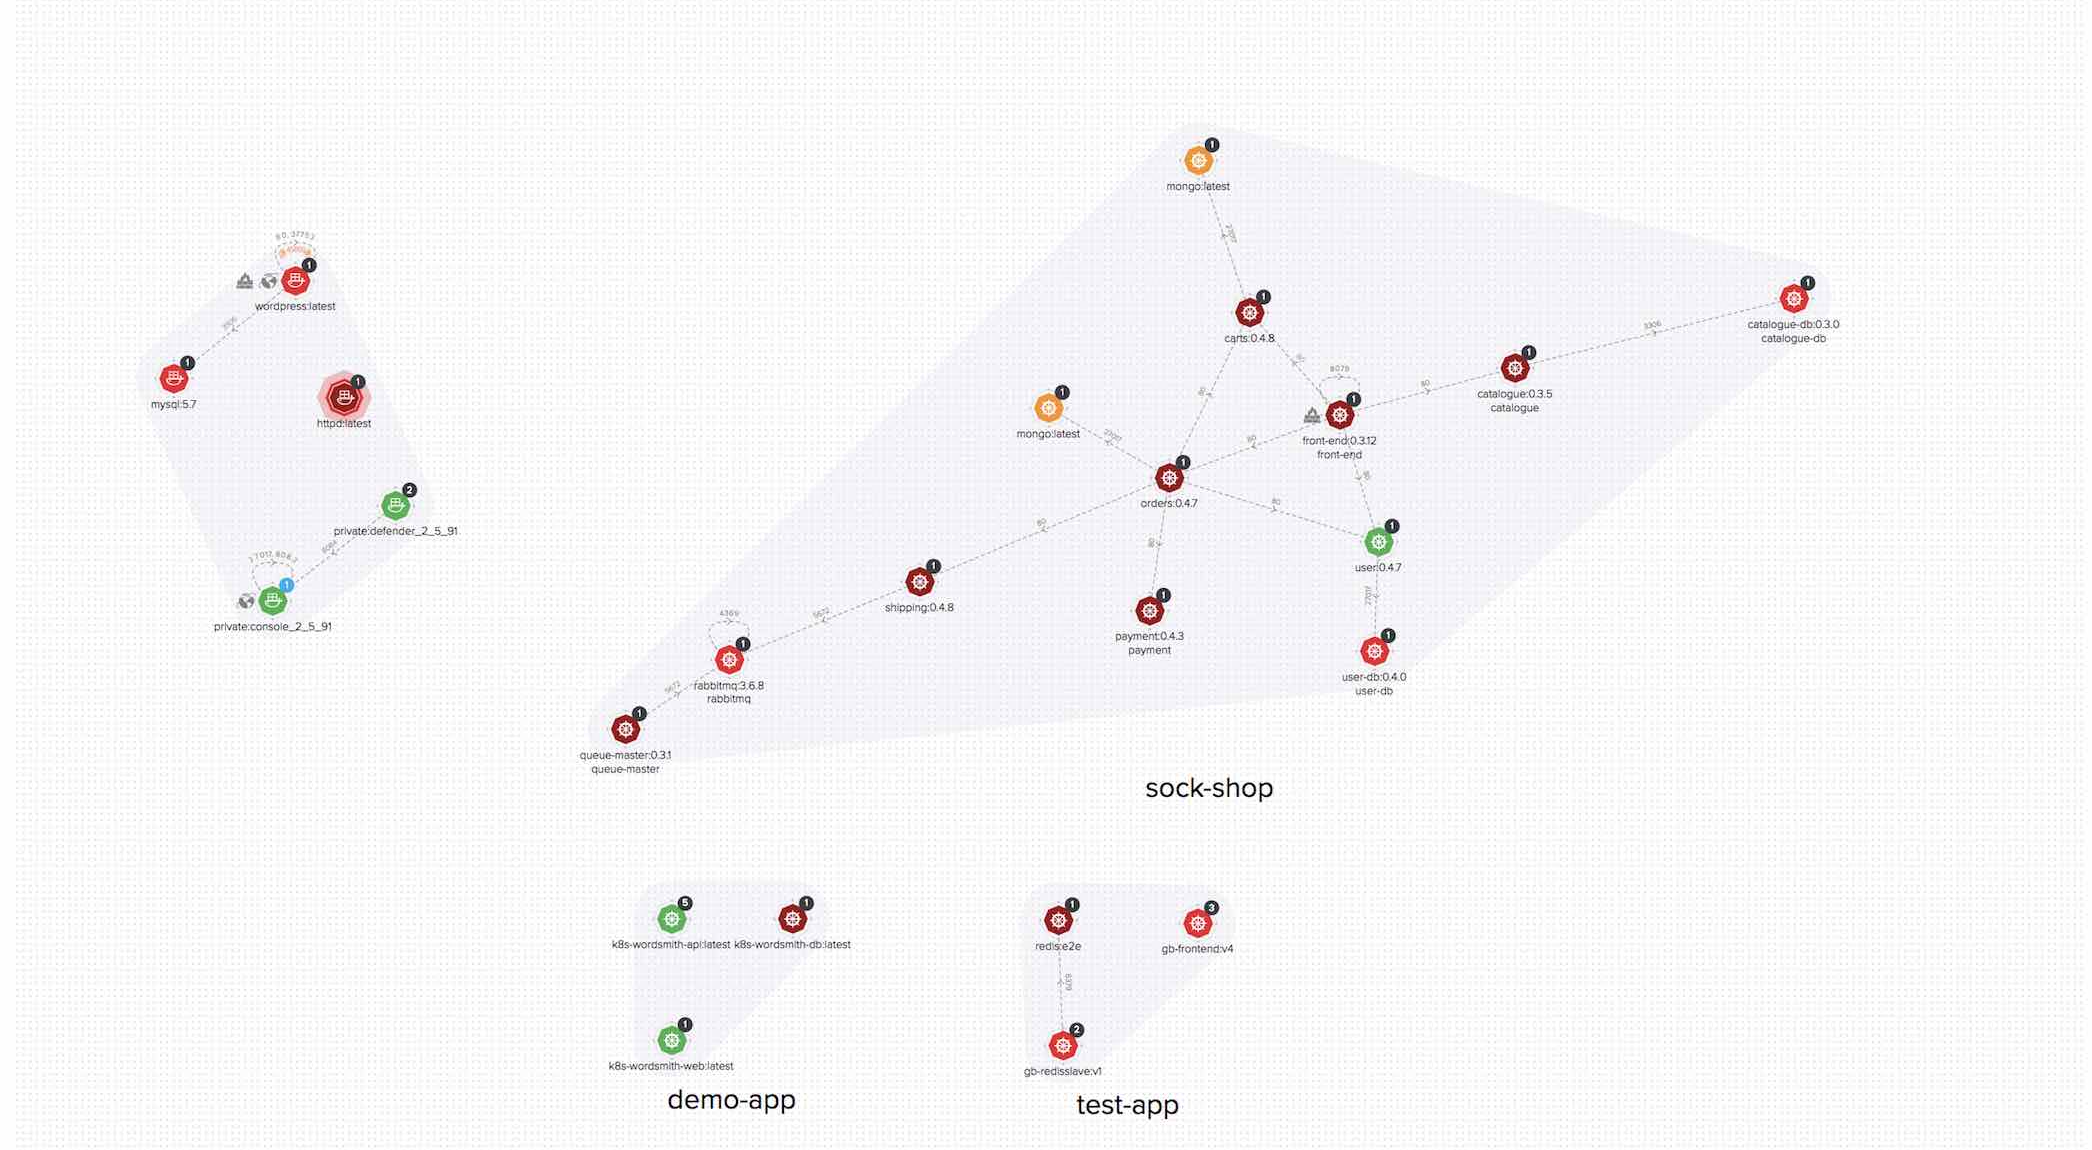
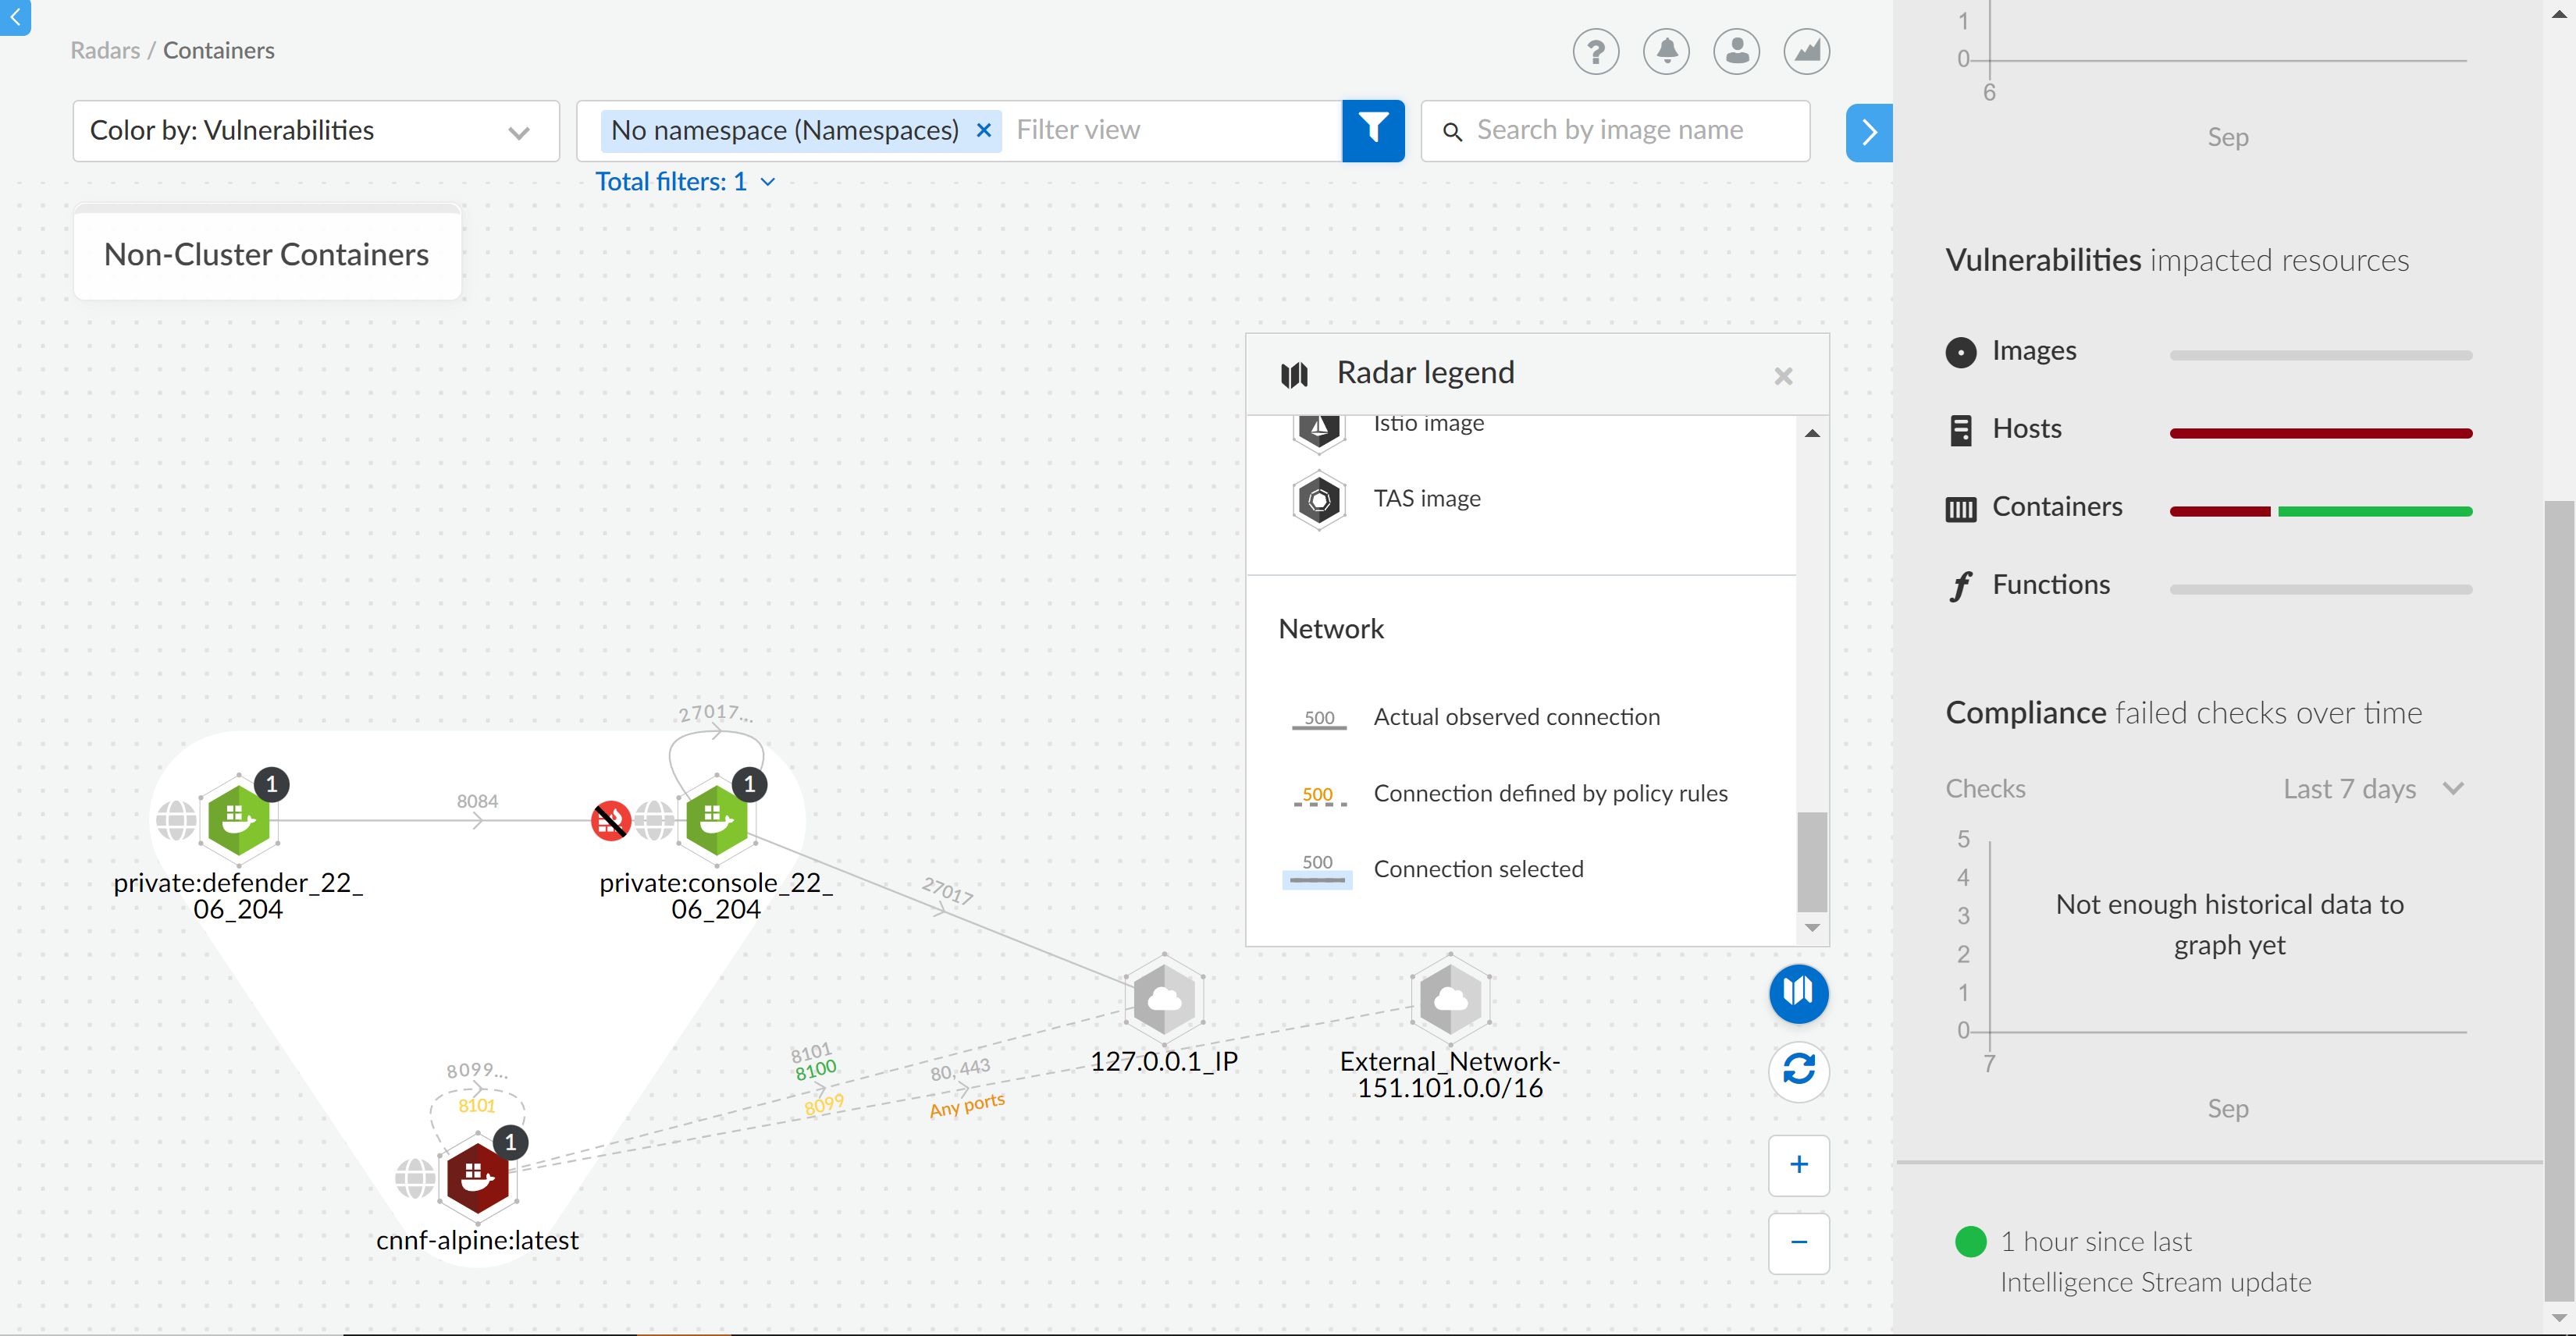
Radar lays out nodes on the canvas to promote easy analysis of your containerized apps. Interconnected nodes are laid out so network traffic flows from left to right. Traffic sources are weighted to the left, while destinations are weighted to the right. Single, unconnected nodes are arranged in rows at the bottom of the canvas.
Nodes are color-coded based on the highest severity vulnerability or compliance issue they contain, and reflect the currently defined vulnerability and compliance policies.
Manually rescan your environment if you edit an existing compliance/vulnerability policy to update the compliance/vulnerability issues in the radar view.
Color coding lets you quickly spot trouble areas in your deployment.
* Dark Red — High risk. One or more critical severity vulnerabilities detected.
* Red — High severity vulnerabilities detected.
* Orange — Medium vulnerabilities detected.
* Green — Denotes no vulnerabilities detected.
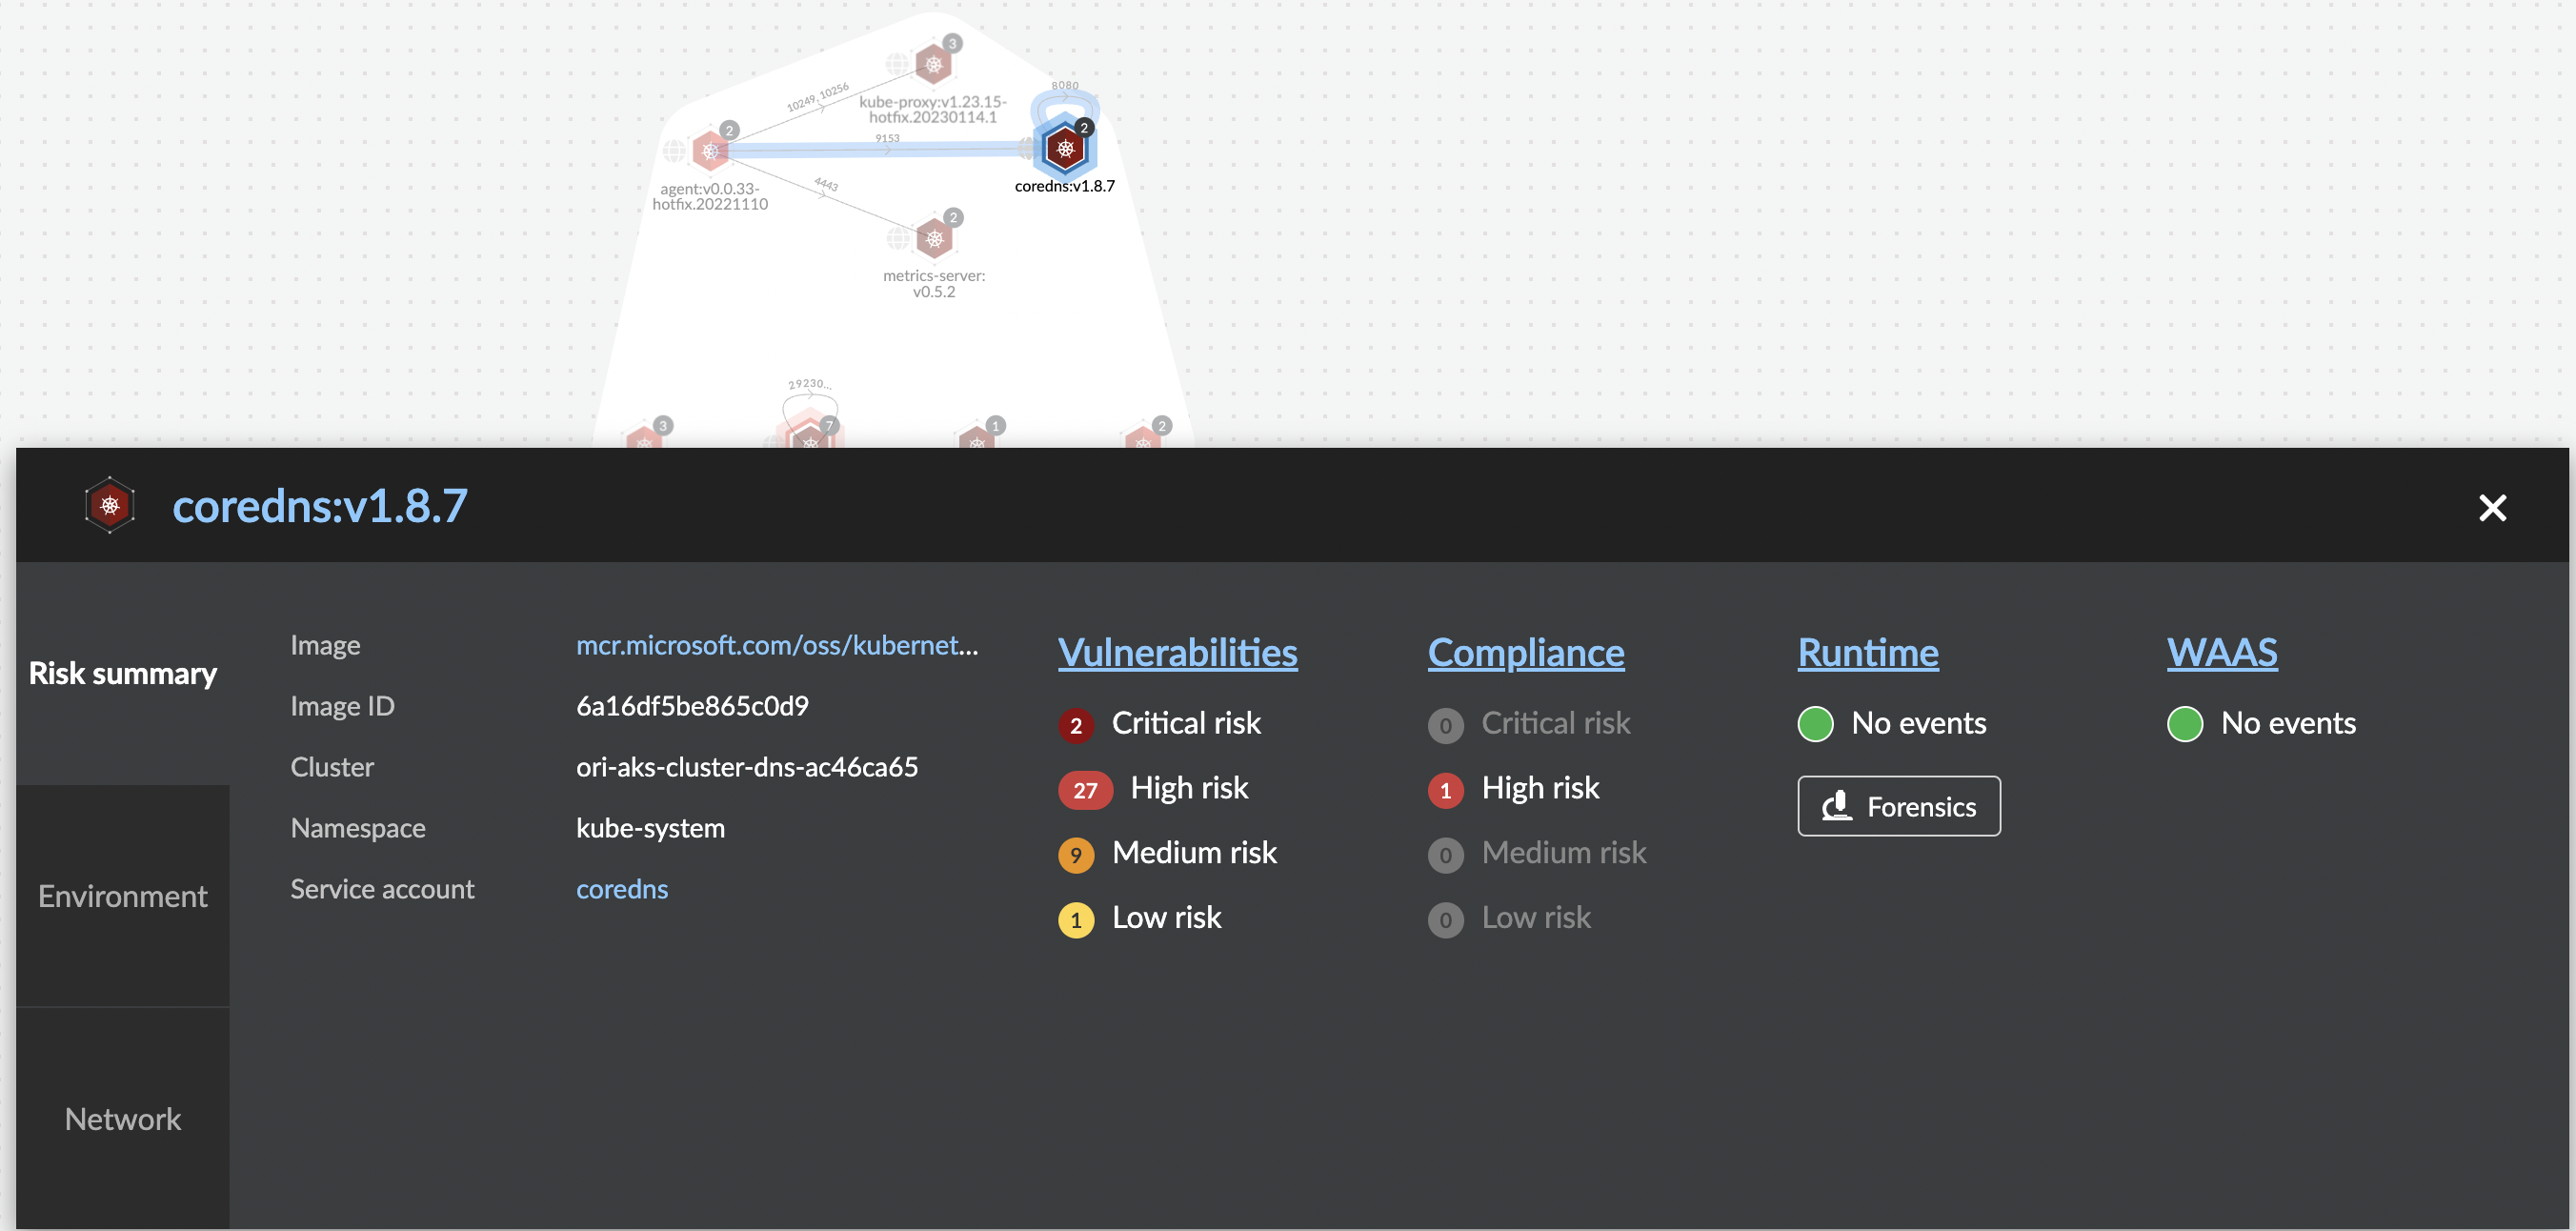
The numeral encased by the circle indicates the number of containers represented by the node. For example, a single Kubernetes DNS node may represent five services. The color of the circle specifies the state of the container’s runtime model. A blue circle means the container’s model is still in learning mode. A black circle means the container’s model is activated. A globe symbol indicates that a container can access the Internet.
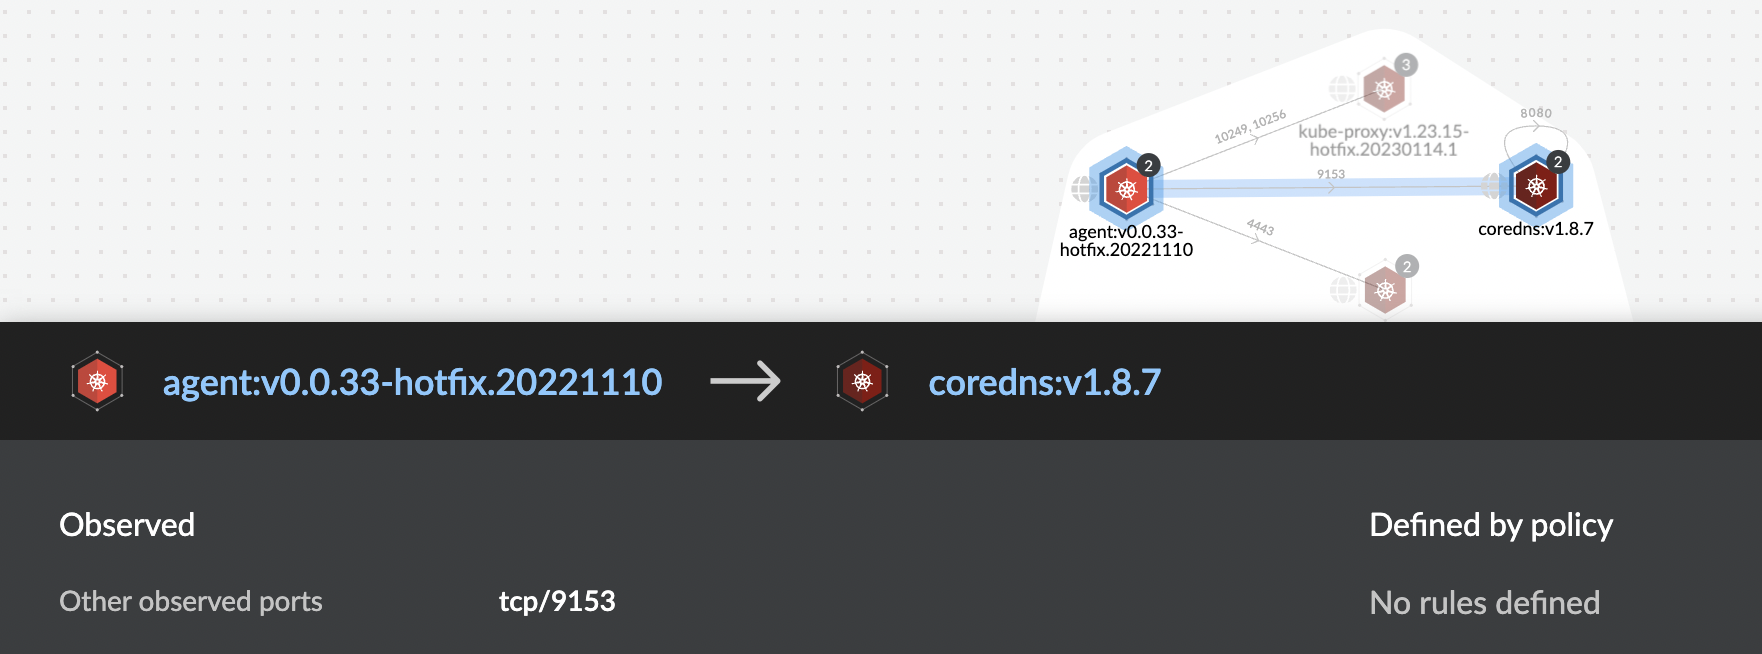
Connections between running containers are depicted as arrows in Radar. Click on an arrow to get more information about the direction of the connection and the port.
The initial zoomed out view gives you a bird’s-eye view of your deployments. Deployments are grouped by namespace. A red pool around a namespace indicates an incident occurred in a resource associated with that namespace.
You can zoom-in to get details about each running container. Select an individual pod to drill down into its vulnerability report, compliance report, runtime anomalies, and WAAS events.
### Service account monitoring
Kubernetes has a rich RBAC model based on the notion of service and cluster roles. This model is fundamental to the secure operation of the entire cluster because these roles control access to resources and services within namespaces and across the cluster. While these service accounts can be manually inspected with `kubectl`, it’s difficult to visualize and understand their scope at scale.
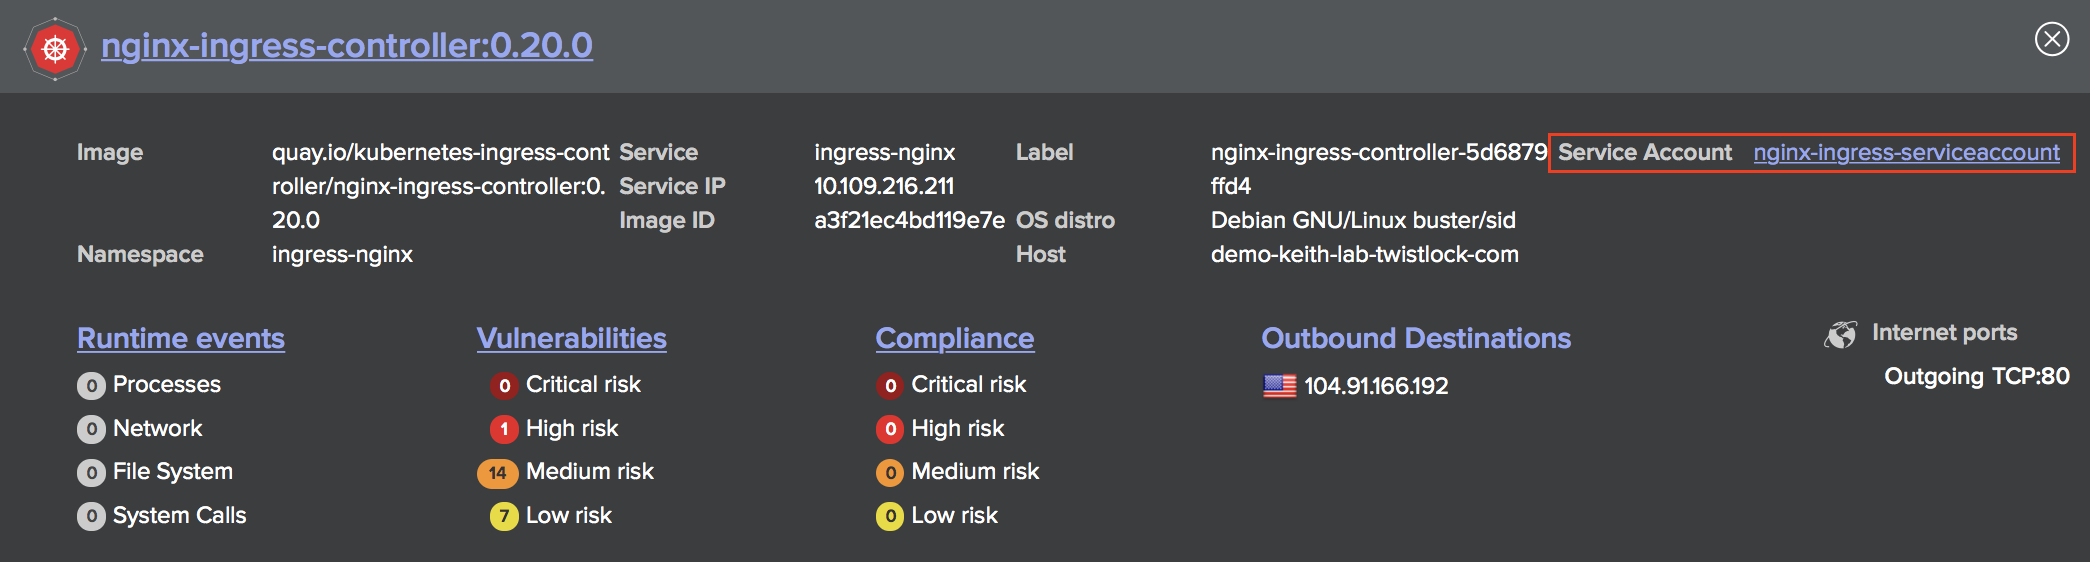
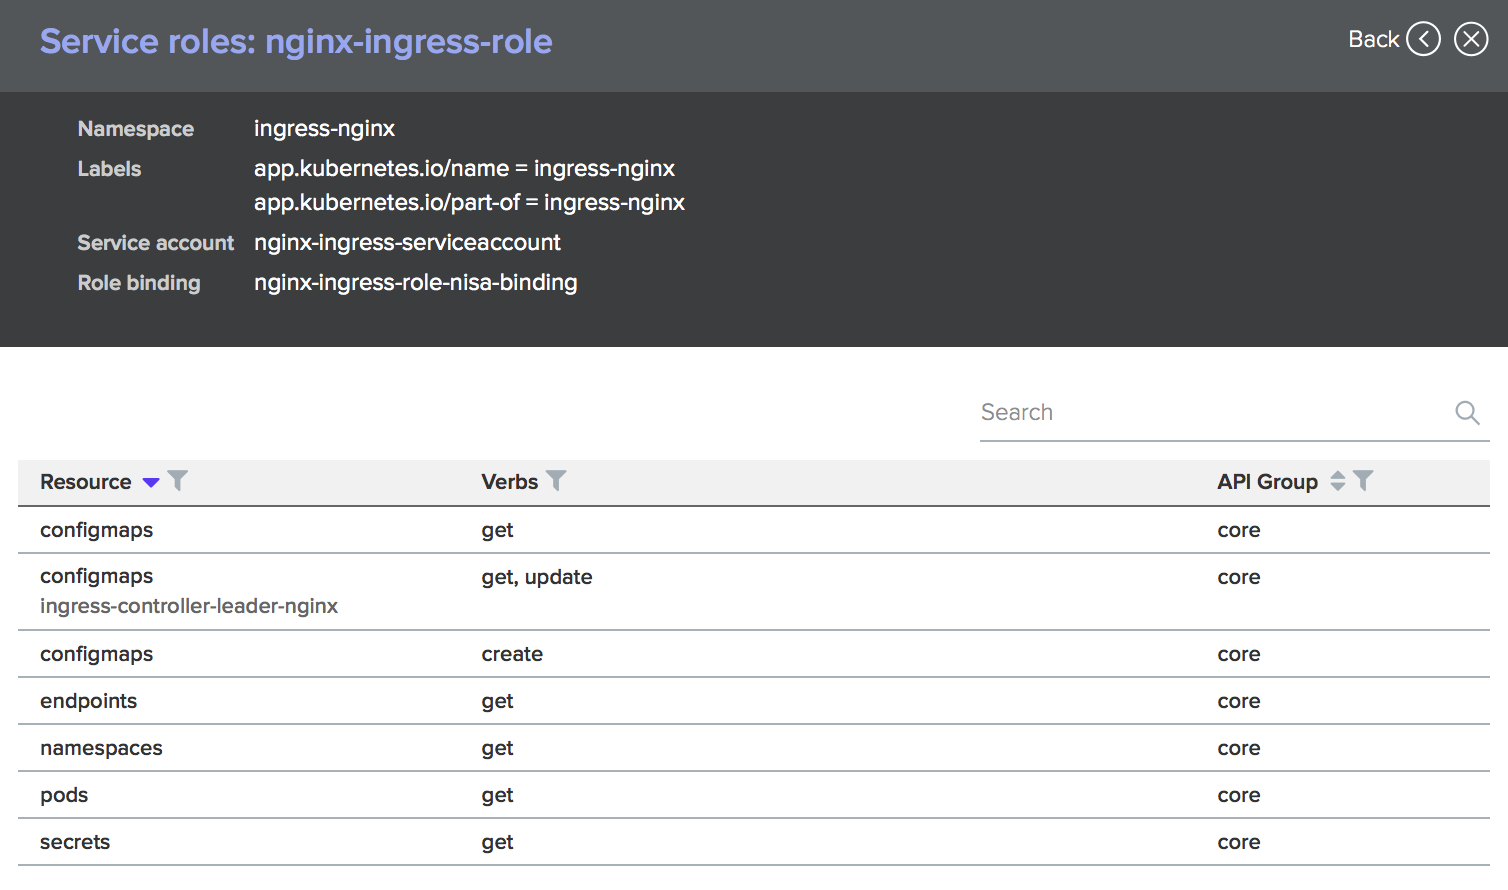
Radar provides a discovery and monitoring tool for service accounts. Every service account associated with a resource in a cluster can easily be inspected. For each account, Prisma Cloud shows detailed metadata describing the resources it has access to and the level of access it has to each of them. This visualization makes it easy for security staff to understand role configuration, assess the level of access provided to each service account, and mitigate risks associated with overly broad permissions.
Clicking on a node opens an overlay, and reveals the service accounts associated with the resource.
Clicking on the service accounts lists the service roles and cluster roles.
Service account monitoring is available for Kubernetes and OpenShift clusters. When you install the Defender DaemonSet, enable the 'Monitor service accounts' option.
### Istio monitoring
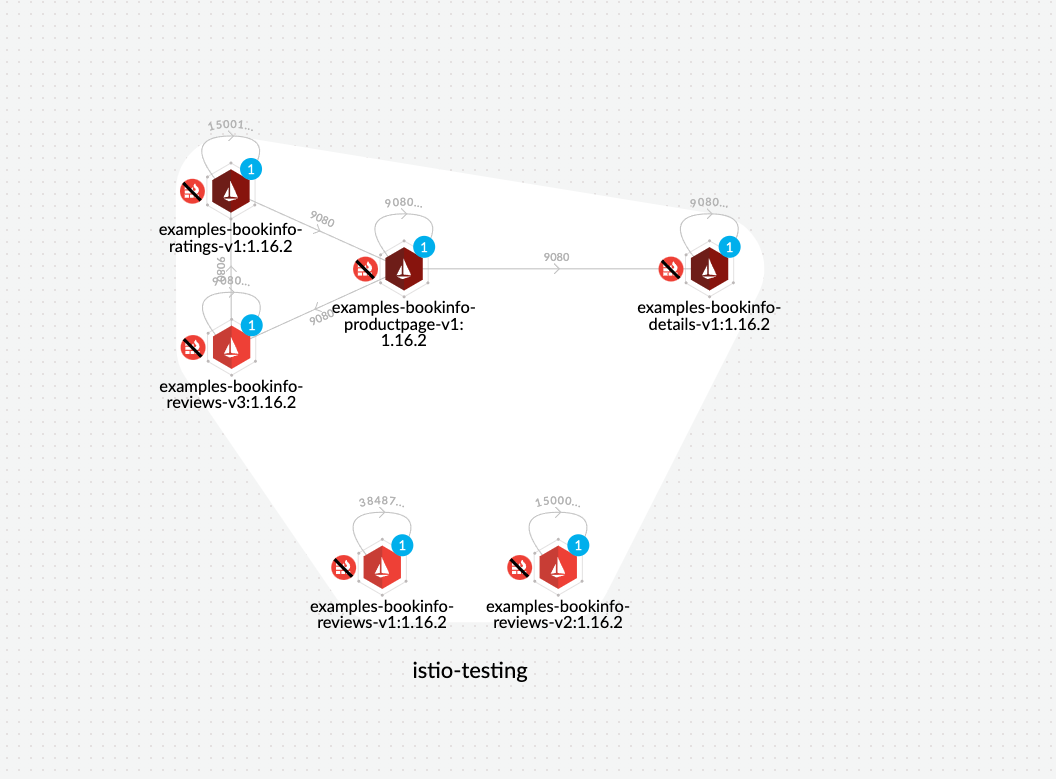
When Defender DaemonSets are deployed with Istio monitoring enabled, Prisma Cloud can discover the service mesh and show you the connections for each service. Services integrated with Istio display the Istio logo.
Istio monitoring is available for Kubernetes and OpenShift clusters. When you install the Defender DaemonSet, enable the 'Monitor Istio' option.
### WAAS connectivity monitor
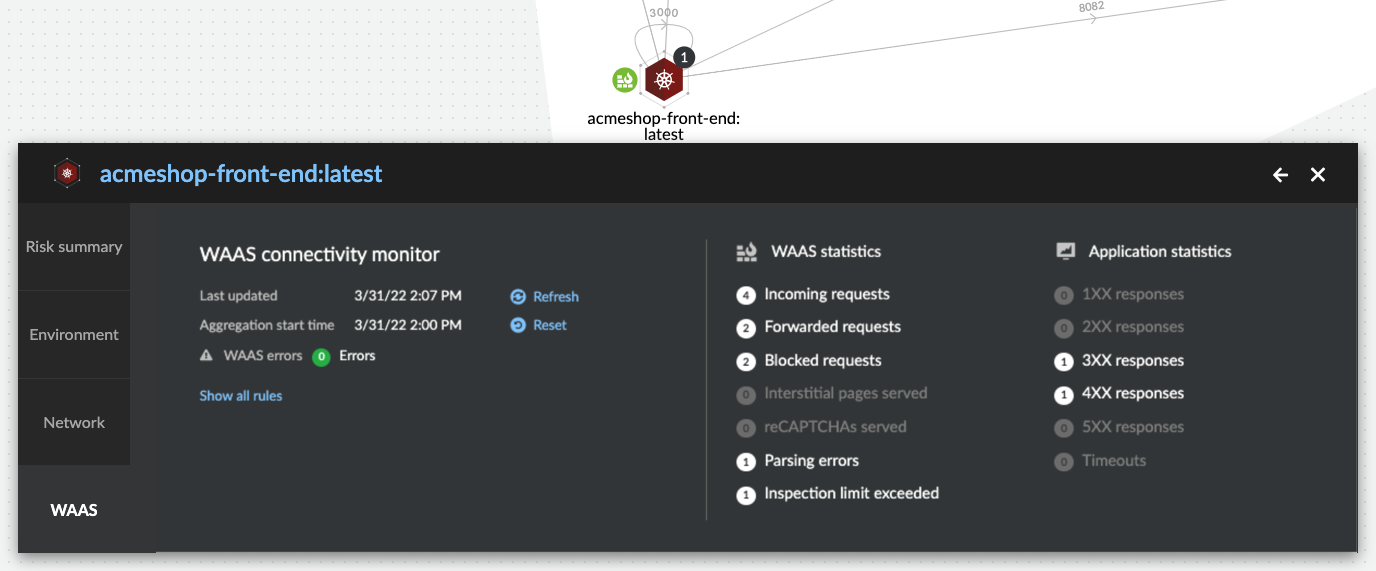
[WAAS](/admin-guide/33/web-application-and-api-security-waas/waas-intro.md) connectivity monitor monitors the connection between WAAS and the protected application.
WAAS connectivity monitor aggregates data on pages served by WAAS and the application responses.
In addition, it provides easy access to WAAS-related errors registered in the Defender logs (Defenders sends logs to the Console every hour). a WAAS monitoring is only available when you select an image or host protected by WAAS.
* **Last updated** - Most recent time when WAAS monitoring data was sent from the Defenders to the Console (Defender logs are sent to the Console on an hourly basis). By clicking on the **refresh** button users can initiate sending of newer data.
* **Aggregation start time** - Time when data aggregation began. By clicking on the **reset** button users can reset all counters.
* **WAAS errors** - To view recent errors related to a monitored image or host, click the **View recent errors** link.
* **WAAS statistics:**
* *Incoming requests* - Count of HTTP requests inspected by WAAS since the start of aggregation.
* *Forwarded requests* - Count of HTTP requests forwarded by WAAS to the protected application.
* *Interstitial pages served* - Count of interstitial pages served by WAAS (interstitial pages are served once [Prisma Sessions Cookies](/admin-guide/33/web-application-and-api-security-waas/waas-advanced-settings.md#prisma-session) are enabled).
* *reCAPTCHAs served* - Count of reCAPTCHA challenges served by WAAS (when enabled as part of [bot protection](/admin-guide/33/web-application-and-api-security-waas/waas-bot-protection.md)).
* *Blocked requests* - Count of HTTP requests blocked by WAAS since the start of aggregation.
* *Inspection limit exceeded* - Count of HTTP requests since the start of aggregation, in which the body content length exceeded the inspection limit set in the [advanced settings](/admin-guide/33/web-application-and-api-security-waas/waas-advanced-settings.md).
* *Parsing errors* - Count of HTTP requests since the start of aggregation, where WAAS encountered an error when trying to parse the message body according to the `Content-Type` HTTP request header.
* **Application statistics**
* Count of server responses returned from the protected application to WAAS grouped by HTTP response code prefix
* Count of timeouts (a timeout is counted when a request is forwarded by WAAS to the protected application with no response received within the set timeout period).
Existing WAAS and application statistics counts will be lost once users reset the aggregation start time. **`Reset`** will **not** affect WAAS errors and will not cause recent errors to be lost.
For more details on WAAS deployment, monitoring and troubleshooting, refer to the [WAAS deployment page](https://github.com/PaloAltoNetworks/pc-docs-md/tree/main/compute-edition/33/admin-guide/waas/deploy-waas/deploy-waas.md).
## Host pivot
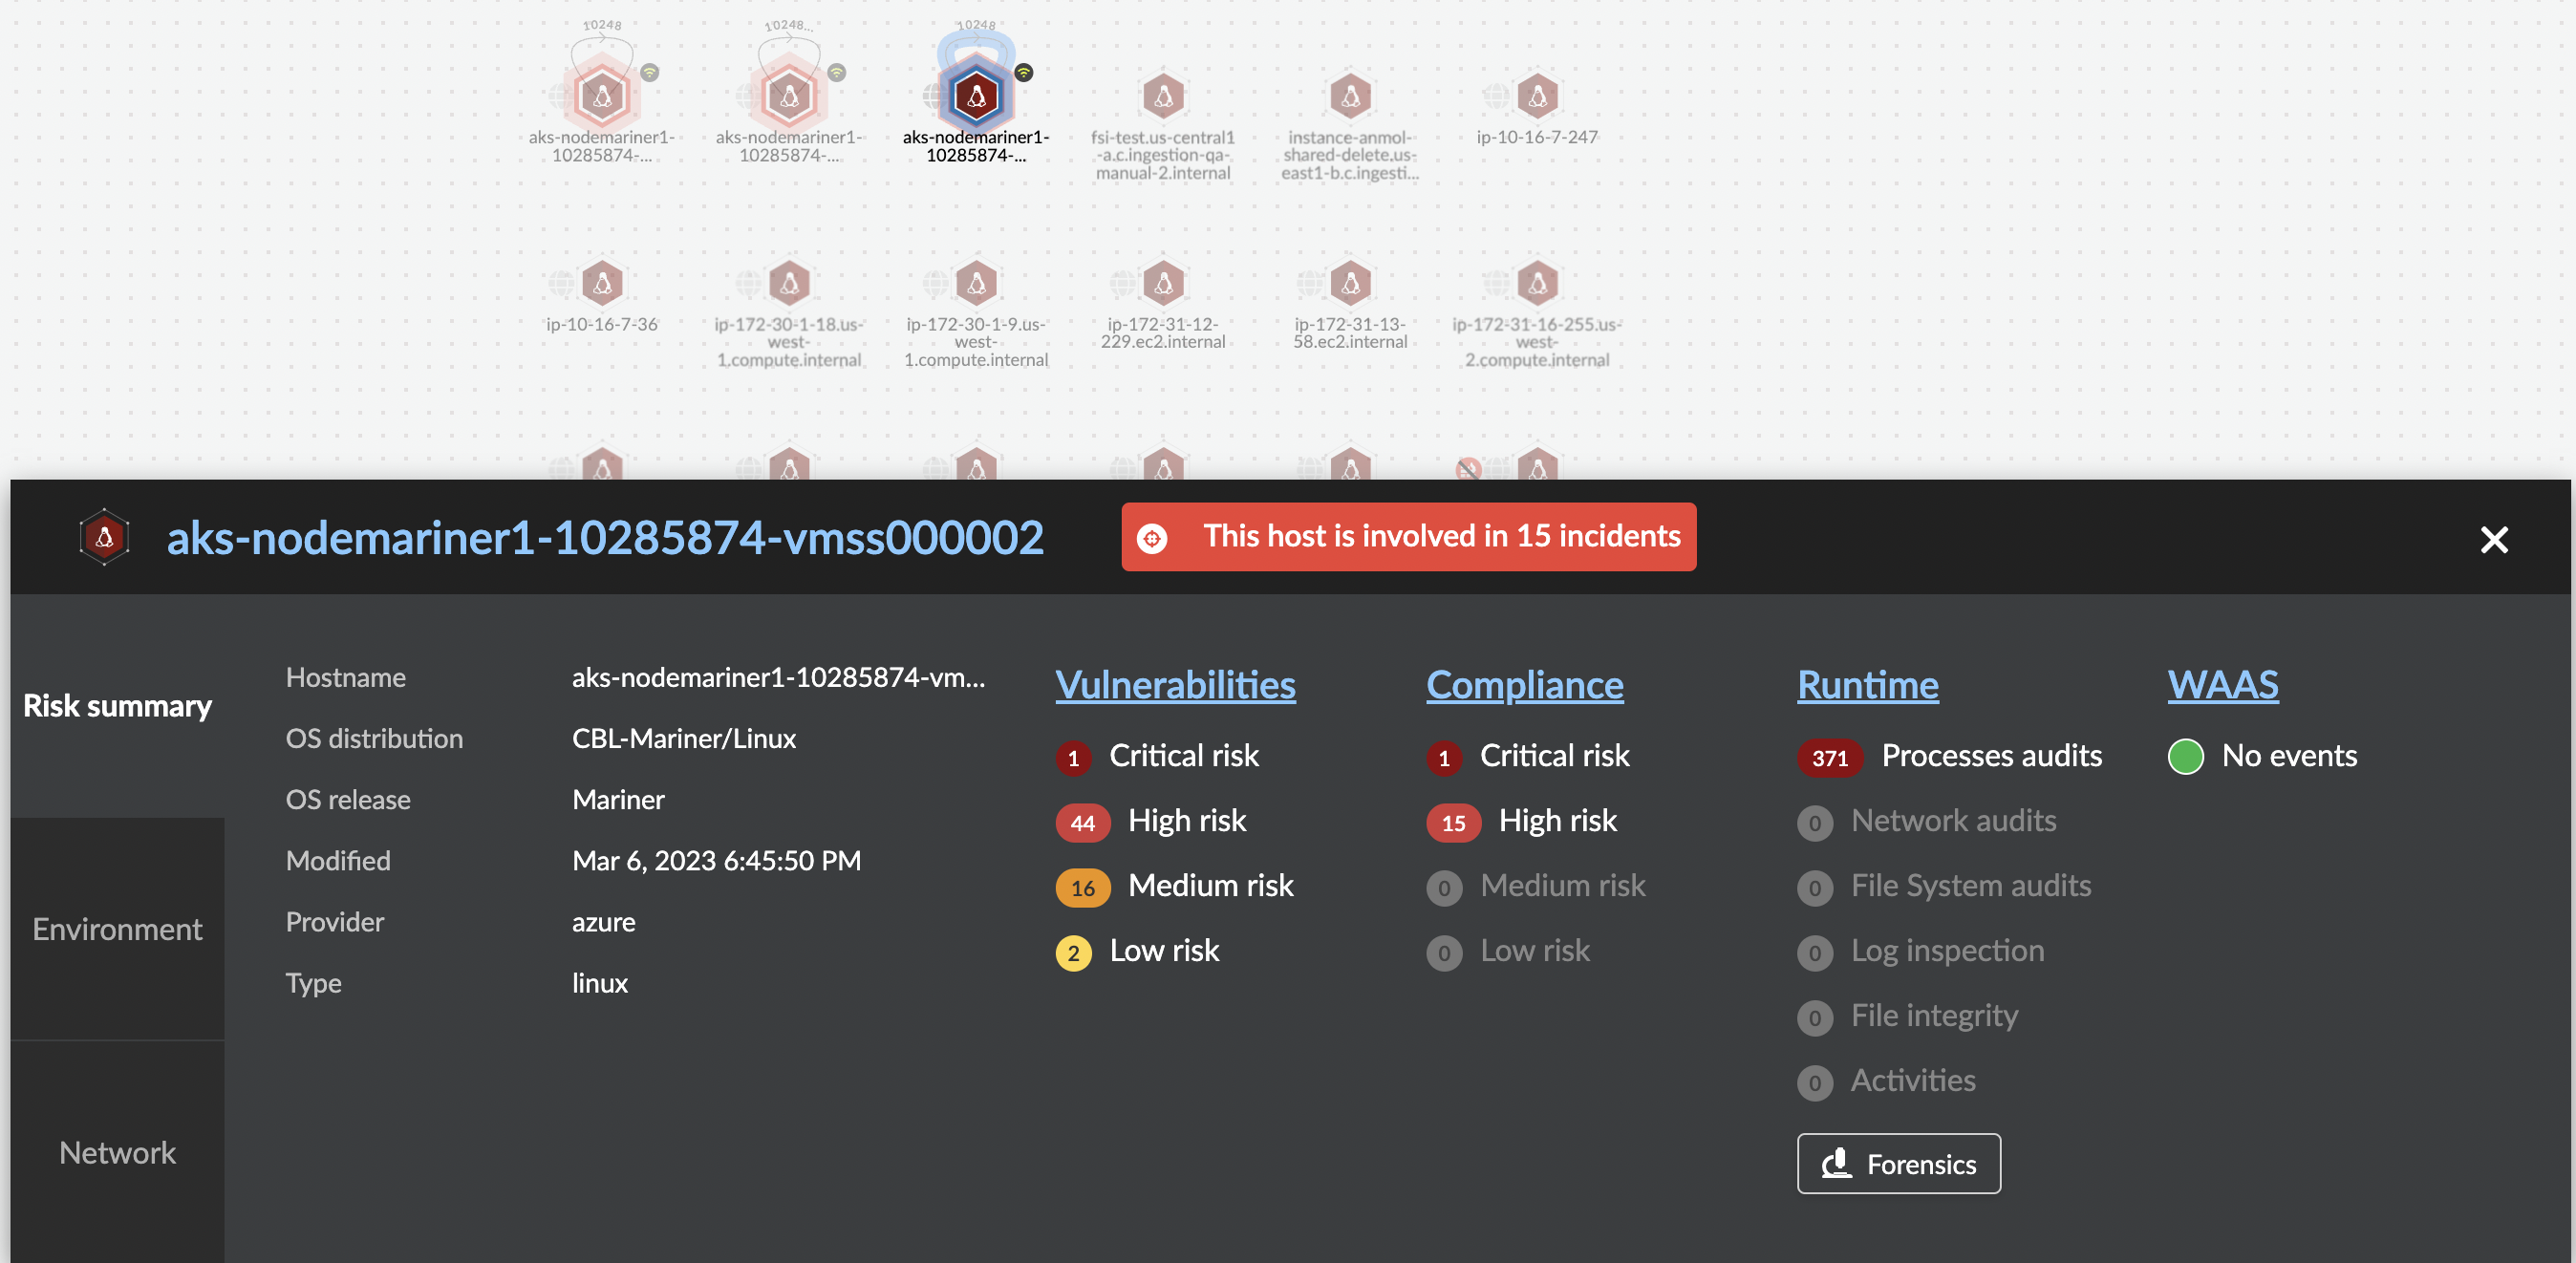
The Radar view shows the hosts in your environment, how these hosts communicate with each other over the network, and their security posture.
Each node in the host pivot represents a host machine. The mesh shows host-to-host communication.
The color of a node represents the most severe issue detected.
* Dark Red — High risk. One or more critical severity issues detected.
* Red — High severity issues detected.
* Orange — Medium issues detected.
* Green — No issues detected.
When you click on a node, an overlay shows a summary of all the information Prisma Cloud knows about the host. Use the links to drill down into scan reports, audits, and other data.
## Containers pivot
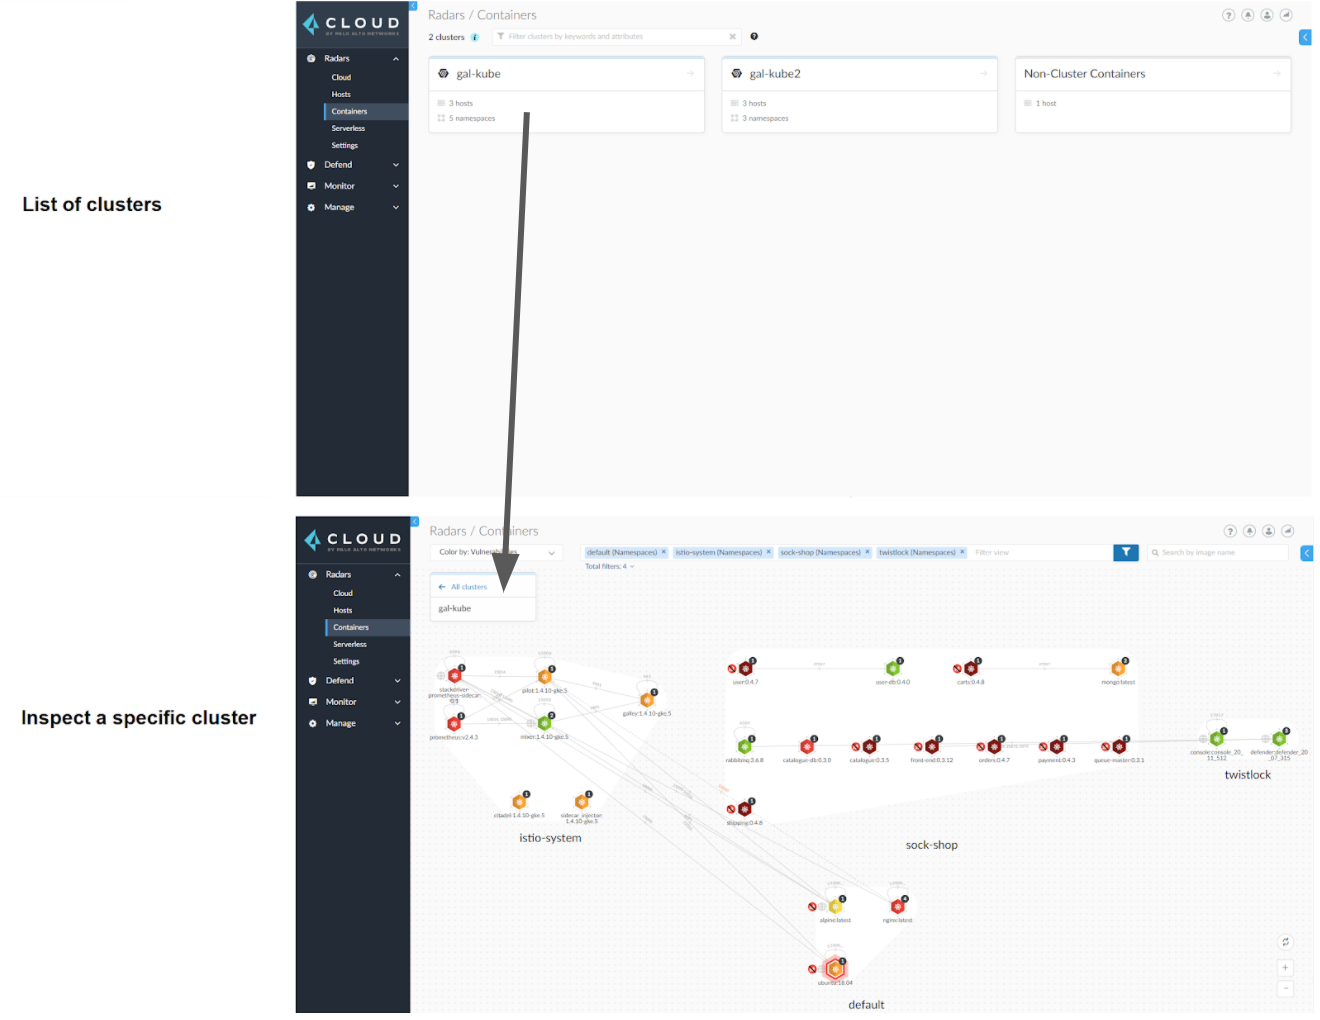
Radar segments your environment by cluster. The main view lists all clusters in your environment. You can view information about each cluster such as its cloud provider, number of namespaces, and number of hosts in the cluster. Clicking a card open the image pivot, which shows you all the namespaces and containers in the cluster.
Defenders report which resources belong to which cluster. For managed clusters, Prisma Cloud automatically retrieves the name from the cloud provider. As a fallback, Prisma Cloud can retrieve the name from your `kubeconfig` file. Finally, you can manually specify the cluster name.
The cluster pivot is currently supported for Kubernetes, OpenShift, and ECS clusters only. All other running containers in your environment are collected in the **Non-Cluster Containers** view.
## Radar Settings
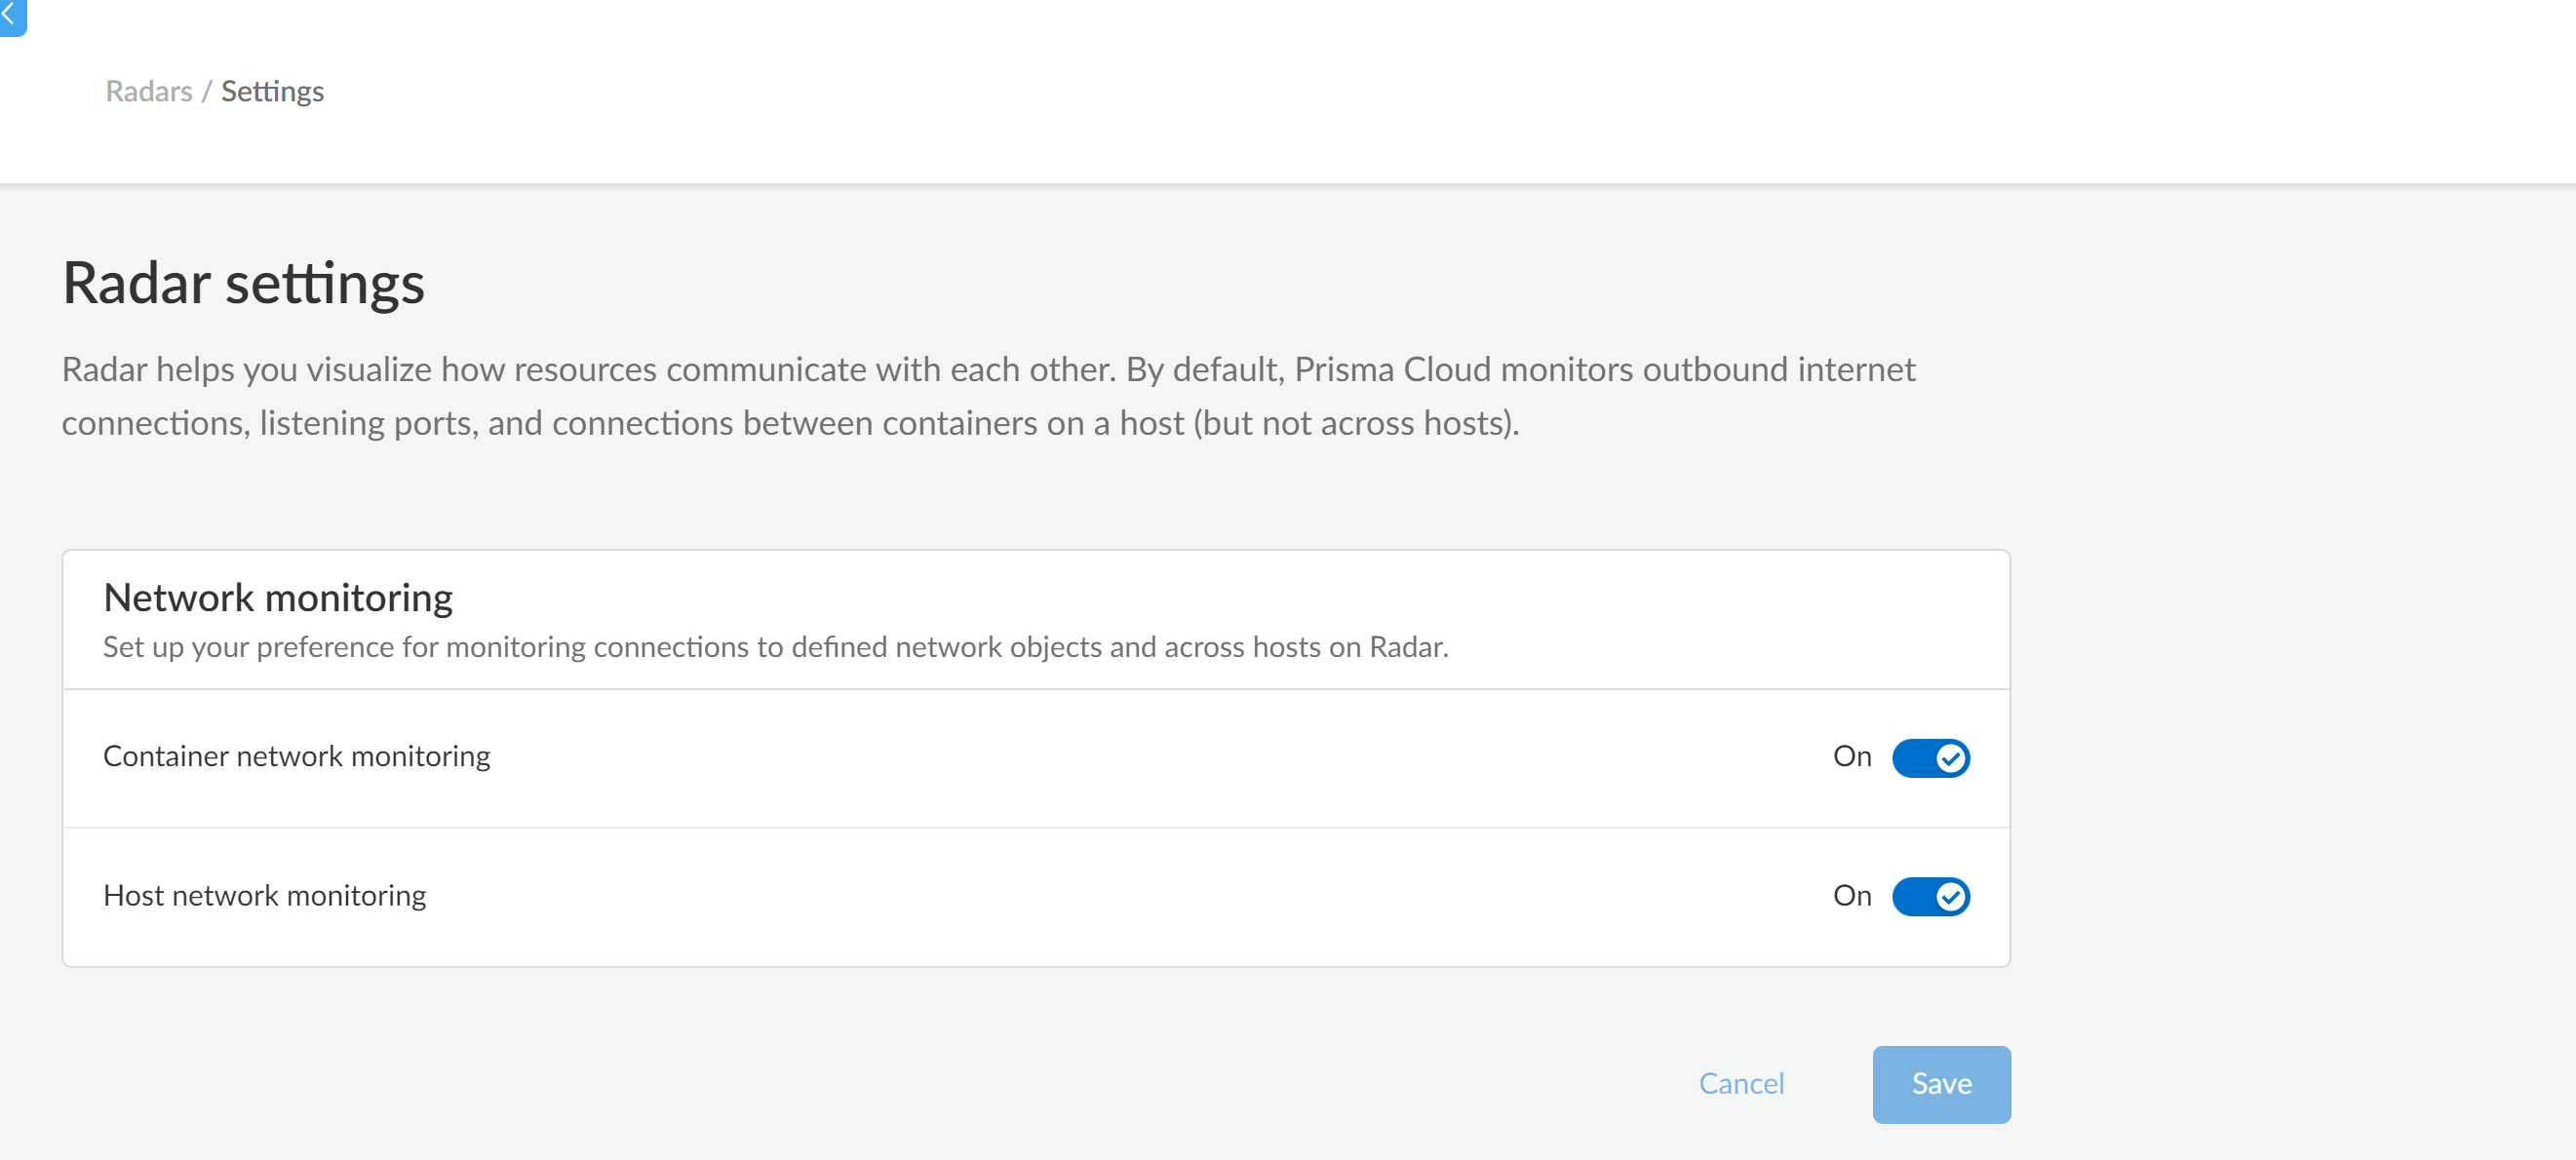
As a Cloud network security measure, you can visualize how your network resources communicate with each other, by enabling **Container network monitoring** and **Host network monitoring** under **Compute > Radars > Settings** and add network objects.
If you have enabled Container/Host Network monitoring under **Compute > Radars > Settings** and are on kernel `v4.15.x` you must upgrade the kernel version to `v5.4.x` or later.
1. Log in to Prisma Cloud Console.
2. Select **Compute > Radars > Settings**.
3. Enable CNNS for hosts and containers.
Enable **Container network monitoring** and **Host network monitoring**.
### Add Network Objects
A network object is an entity or resource that your host or application interacts with and these can be internal or external entities including non-containerized services. For example, a payment gateway might pass information to an external service to verify transactions.
For hosts\
You can configure network objects to enforce traffic destined from a host to a subnet or another host.
For containers\
You can configure network objects to enforce traffic destined from a container (referred to as an image) to a DNS, subnet, or to another container.
1. Log in to Prisma Cloud Console.
2. Create a network object.
After you create a network object, Radar shows any connection established to the network object.
1. Select **Compute > Radars > Settings > Add Network Object**.
2. Enter a Name.
3. Select the Type.
For containers (referred to as an image) and hosts, you must select the scope from a Collection. Some example network objects are:
* Type: Subnet; Value: 127.0.0.1/32
* Type: Subnet; Value: 151.101.0.0./16
* Type: DNS; Value: google.com
* Type: Host; Value: Name of the host from a [collection](/admin-guide/33/configure/collections.md) you have already defined.
* Type: Image; Value: Name of the containerimage from a collection you have already defined.
A subnet network object can reference a range of IP addresses or a single IP address in a CIDR format.
## View Connections on Radar
Radar helps you visualize the connections for a typical microservices app and view your microsegmentation policy, which is an aggregation of all your rules.
When a connection is observed, the dotted line becomes a solid line.
## Troubleshooting: Azure VM Backup Failure Due to Host Network Monitoring
**Problem**
Azure VM backup service might fail when **Host Network Monitoring** is enabled in **Prisma Cloud Compute**, as the default **iptables** rules block traffic to `168.63.129.16`, which facilitates communication between Azure VMs and the Azure infrastructure.
**Cause**
When **Host Network Monitoring** is enabled, some Linux distributions might lose packet ownership information. This, combined with Azure’s default **iptables** rules in the security table, results in legitimate traffic being dropped.
**Workaround**
Choose one of the following solutions:
1. Disable Host Network Monitoring: Navigate to **Console > Radar > Settings**. In the Network monitoring section, toggle off the **Host network monitoring** option.
2. Modify iptables rules by adding the following:
```
iptables -t raw -A OUTPUT -d 168.63.129.16/32 -p tcp -m owner --uid-owner
iptables -I OUTPUT -t security -d 168.63.129.16/32 -p tcp -m mark --mark 11
```
**Note:** The mark `"11"` can be changed, but it must not conflict with marks used by other applications on the host.
---
# Agent Instructions
This documentation is published with GitBook. GitBook is the documentation platform designed so that both humans and AI agents can read, navigate, and reason over technical content effectively. Learn more at gitbook.com.
## Querying This Documentation
If you need additional information that is not directly available in this page, you can query the documentation by asking a question.
Perform an HTTP GET request on the following URL with the `ask` and `goal` query parameters:
```
GET https://docs.prismacloud.io/admin-guide/33/technology-overviews/radar.md?ask=&goal=
```
`ask` is the immediate question: it should be specific, self-contained, and written in natural language.
`goal` is what the user is ultimately trying to achieve, the reason they need the answer. Sharing it helps GitBook give you a better, more relevant answer. A goal is most helpful when it describes the outcome the user wants rather than restating the question. For example, with `ask=how do I create an API token`, a goal like `automate deployments from our CI pipeline` lets GitBook tailor the answer to that use case.
The response will contain a direct answer to the question and relevant excerpts and sources from the documentation.
Use this mechanism when the answer is not explicitly present in the current page, you need clarification or additional context, or you want to retrieve related documentation sections.