> For the complete documentation index, see [llms.txt](https://docs.prismacloud.io/llms.txt). Markdown versions of documentation pages are available by appending `.md` to page URLs; this page is available as [Markdown](https://docs.prismacloud.io/admin-guide/compliance/compliance-explorer.md).
# Compliance Explorer
Compliance Explorer is a reporting tool for compliance rate. Metrics present the compliance rate for resources in your environment on a per-check, per-rule, and per-regulation basis. Report data can be exported to CSV files for further investigation.
The key pivot for Compliance Explorer is failed compliance checks. Compliance Explorer tracks each failed check, and the resources impacted by each failed check. From there, you can further slice and dice the data by secondary facets, such as collection, benchmark, and issue severity.
Compliance Explorer helps you answer these types of questions:
* What is the compliance rate for the entire estate?
* What is the compliance rate for some segment of the estate?
* What is the compliance rate relative to the checks that you consider important?
* Segment by benchmark.
* Segment by specific compliance policy rules. Prisma Cloud supports compliance policies for containers, images, hosts, and serverless functions.
* Which resources (containers, images, hosts, serverless functions) are failing the compliance checks you care about?
To view Compliance Explorer, go to **Monitor > Compliance > Compliance Explorer**.
## Page organization
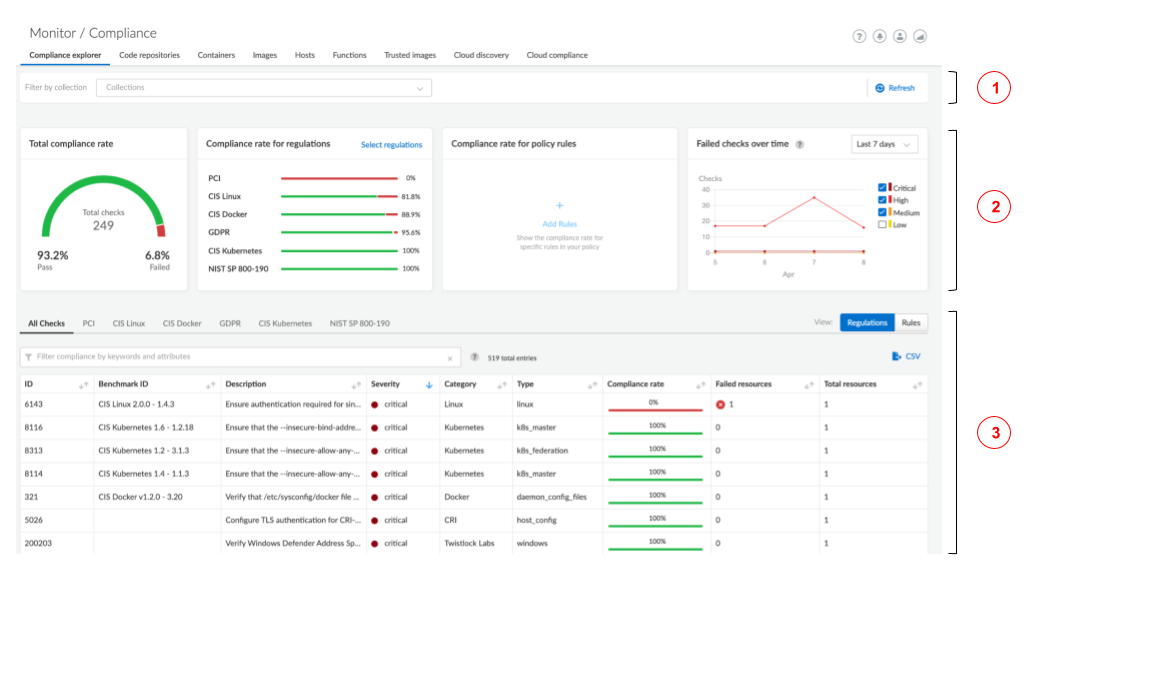
The Compliance Explorer view is organized into three main areas:
**1. Collection filter.** Collections group related resources together. Use them to filter the data in Compliance Explorer. For example, you might want to see how all the entities in the sock-shop namespace in your production cluster comply to the checks in the PCI DSS template.
**2. Roll-up charts.** Configurable charts that summarize compliance data for the perspectives you care about. They report the following data:
* Total compliance rate for your entire estate.
* Compliance rate by regulation. Click **Select regulations** to configure which benchmarks and templates are shown on the page. Benchmarks are industry-standard checklists, such as the CIS Docker Benchmark. Templates are Prisma Cloud-curated checklists Checks are selected from the universe of checks provided in the product that pertain to directives in a regulatory regime, such as the Payment Card Industry Data Security Standard (PCI DSS).
* Compliance rate by rule. Provides another mechanism to surface specific segments of your environment when scrutinizing compliance. Click **Add rule** to configure the card.
* Historical trend chart for compliance rate. Shows how the compliance rate has changed over time.
The lists in the regulation and rule cards are sorted by compliance rate (the lowest compliance rate first).
**3. Results table.** Shows a detailed view of all compliance checks and their associated compliance rates. These checks are displayed relative to the following factors:
* **Policies**: Compliance checks that are enabled according to your configured policies.
* **Collection**: The specific collection if selected on **Filter by collection** at the top of the page.
* **Filters**: Any applied filters, such as displaying only critical severity issues.
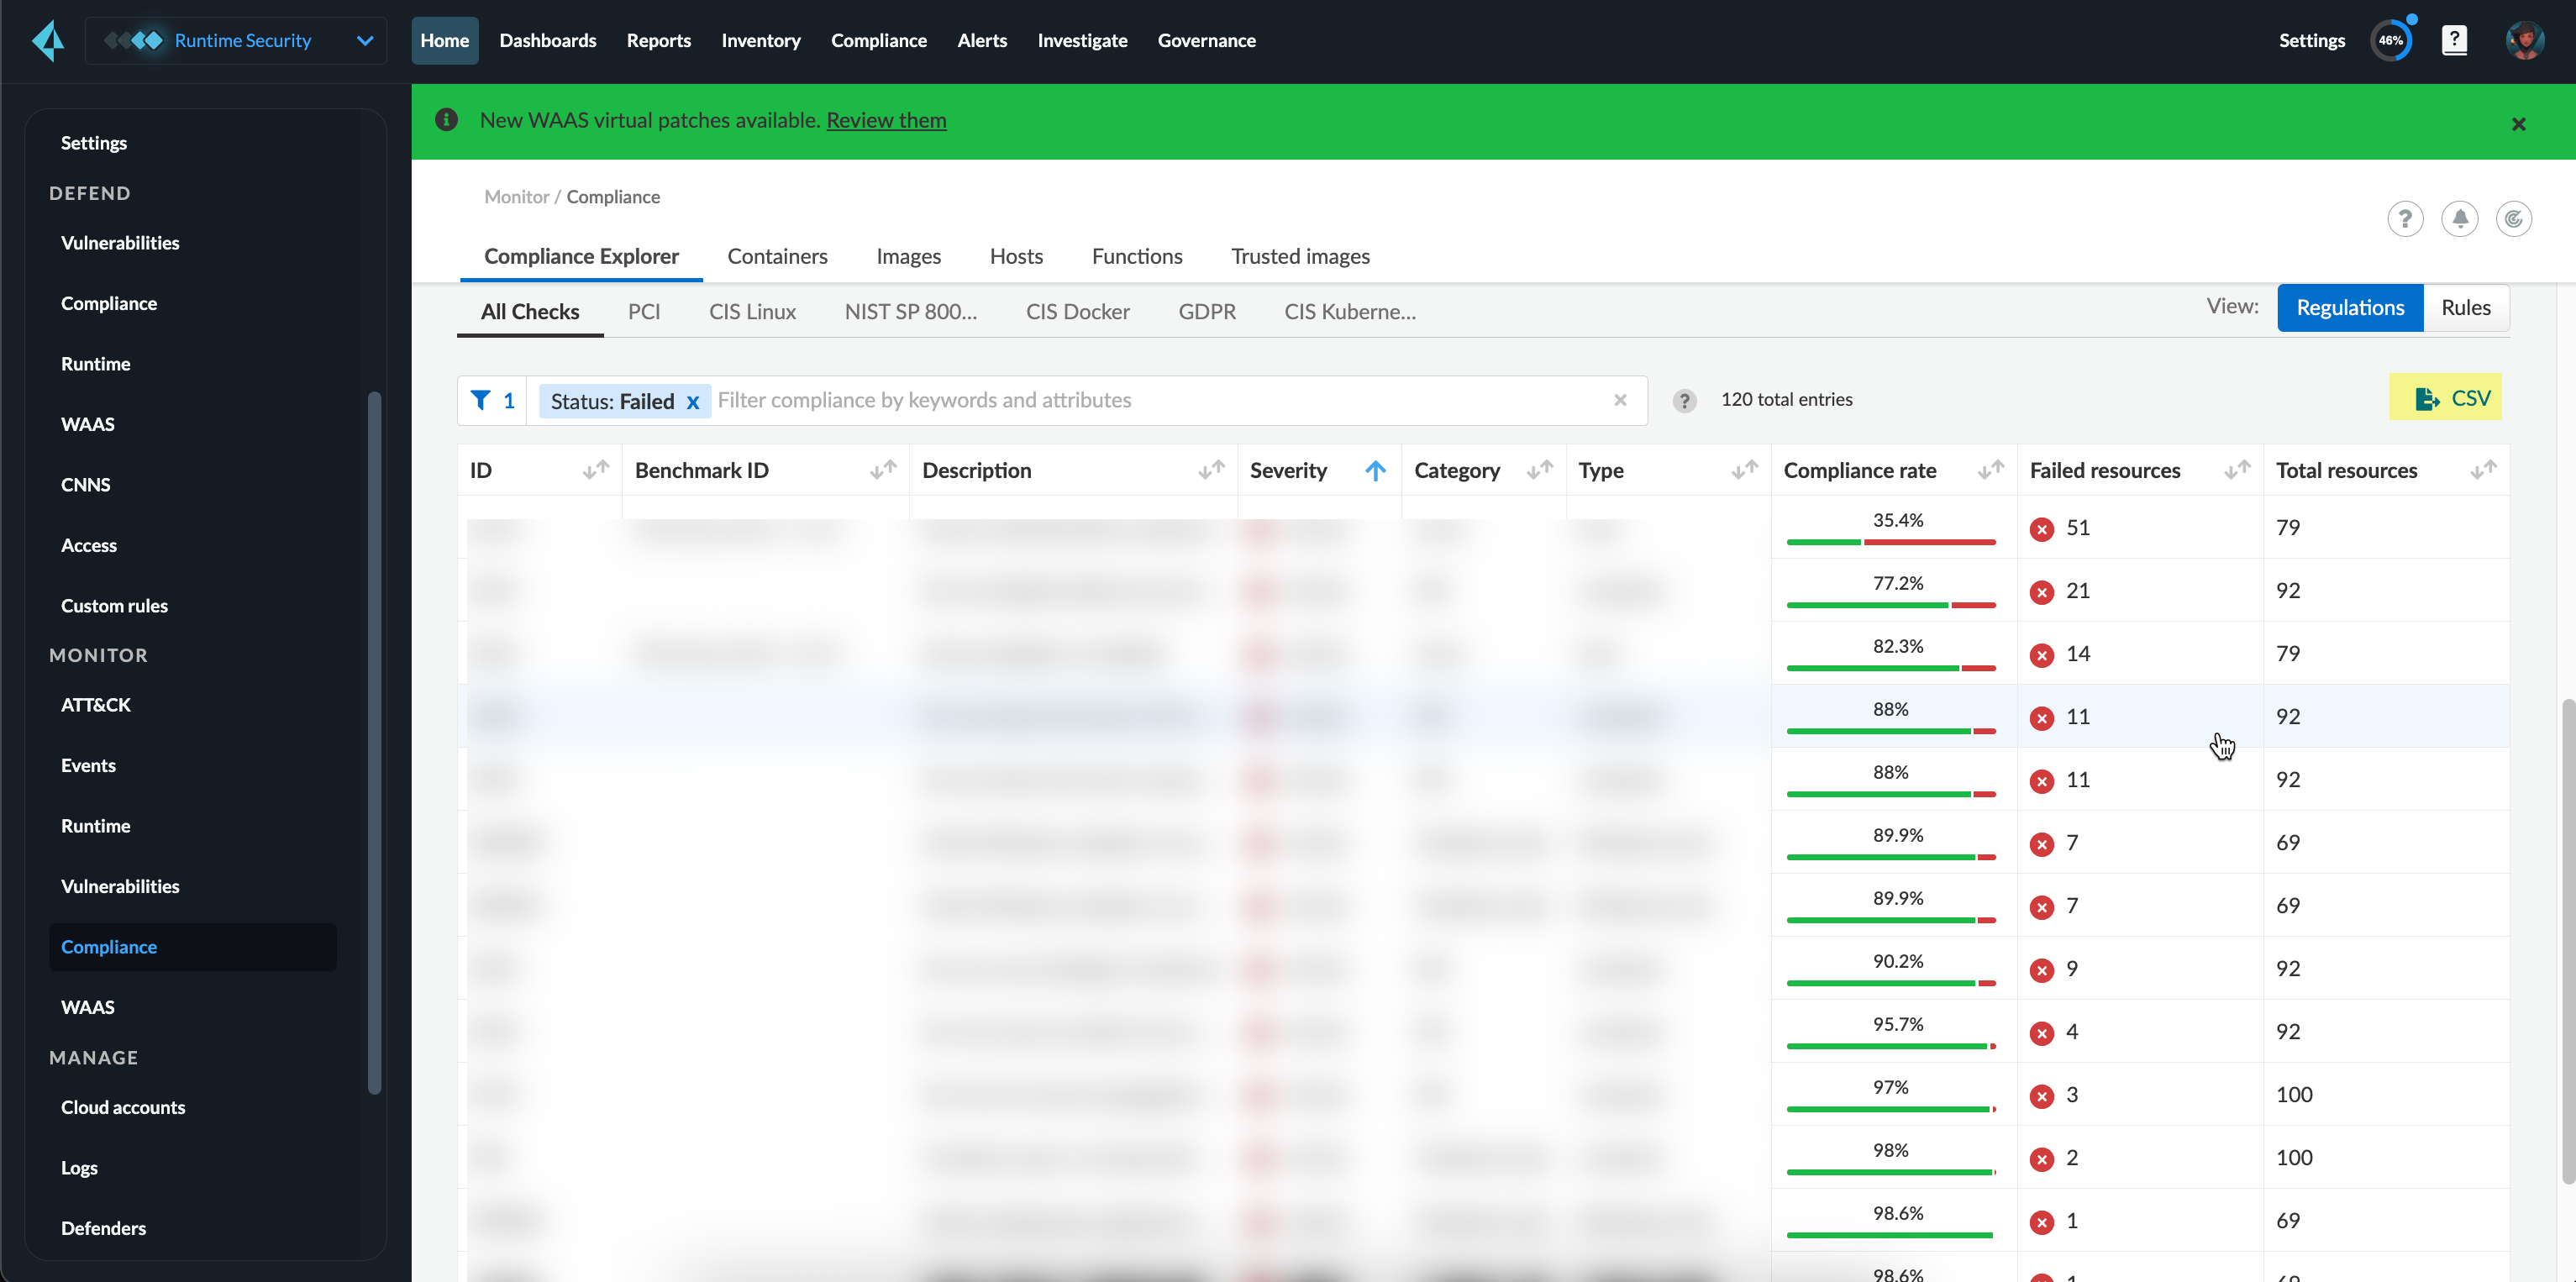
Each compliance check is identified by a unique ID and can be either enabled or disabled. The **Compliance rate** column indicates the percentage of resources passed or failed the corresponding compliance check, along with the **Benchmark ID**. The table includes the following columns:
* **ID**: Unique identifier for the compliance check.
* **Benchmark ID**: The ID associated with the benchmark or standard against which the compliance check is evaluated.
* **Description**: A brief explanation of the compliance check.
* **Severity**: The level of severity associated with the check, such as Critical, High, Medium, or Low.
* **Category**: The category or type of compliance check, such as Security, Configuration, or Identity.
* **Type**: Specifies whether the check is associated with a specific policy, rule, or standard.
* **Compliance Rate**: The percentage of resources that passed the compliance check.
* **Failed Resources**: The number of resources that did not pass the compliance check.
* **Total Resources**: The total number of resources evaluated in the check.
**Tabs and Views**
* **Tabs**: The tabs organize results by Benchmark or Template. The visibility of these tabs depends on how you configure the corresponding **Compliance Rate for Regulations Roll-Up card**.
* **Rules View**: If you switch to the **Rules** view, the tabs will display the rules selected in the **Compliance Rate for Policy Rules Roll-Up card**.
**Sorting and Filtering**
* **Sorting**: By default, the table is sorted by Severity (primary sort key) and then by Compliance Rate (secondary sort key). If no parameters are specified, Compliance Explorer shows all IDs by default. Use the **Category:Prisma Cloud Labs** filter in the table to show the [malware scanning](https://github.com/PaloAltoNetworks/pc-docs-md/tree/main/compute-edition/34/admin-guide/operations/malware.md) results obtained using Advanced WildFire after an [agentless scan](https://github.com/PaloAltoNetworks/pc-docs-md/tree/main/compute-edition/34/agentless-scanning/agentless-scanning.md).
* **Filtering**: You can filter the table to display only failed checks by setting the **Status** to **Failed**.
**Exporting Data**
You can export the data to a CSV file for further analysis. The exported data reflects any applied filters and collections, allowing you to narrow down and customize the data before exporting.
## Statistics
The data in Compliance Explorer is calculated every time the page is loaded, and it’s based on data from the latest scan. Data in the trend graph is based on snapshots taken every 24 hours.
You can force Console to recalculate statistics from the latest scan data by clicking the **Refresh** button. The **Refresh** button displays a red indicator when there’s a change in the following resources in your environment:
* Containers.
* Images.
* Hosts.
* Serverless functions.
For example, the refresh indicator is shown when new containers are detected. It’s also shown when containers are deleted.
No red refresh indicator is shown if you simply change the compliance policy. If you change the compliance policy, manually force Prisma Cloud to rescan your environment (or wait for the next periodic scan), and then refresh the Compliance Explorer.
---
# Agent Instructions
This documentation is published with GitBook. GitBook is the documentation platform designed so that both humans and AI agents can read, navigate, and reason over technical content effectively. Learn more at gitbook.com.
## Querying This Documentation
If you need additional information that is not directly available in this page, you can query the documentation by asking a question.
Perform an HTTP GET request on the following URL with the `ask` and `goal` query parameters:
```
GET https://docs.prismacloud.io/admin-guide/compliance/compliance-explorer.md?ask=&goal=
```
`ask` is the immediate question: it should be specific, self-contained, and written in natural language.
`goal` is what the user is ultimately trying to achieve, the reason they need the answer. Sharing it helps GitBook give you a better, more relevant answer. A goal is most helpful when it describes the outcome the user wants rather than restating the question. For example, with `ask=how do I create an API token`, a goal like `automate deployments from our CI pipeline` lets GitBook tailor the answer to that use case.
The response will contain a direct answer to the question and relevant excerpts and sources from the documentation.
Use this mechanism when the answer is not explicitly present in the current page, you need clarification or additional context, or you want to retrieve related documentation sections.