> For the complete documentation index, see [llms.txt](https://docs.prismacloud.io/llms.txt). Markdown versions of documentation pages are available by appending `.md` to page URLs; this page is available as [Markdown](https://docs.prismacloud.io/admin-guide/runtime-defense/attack.md).
# ATTACK explorer
Prisma Cloud’s monitoring section includes an Att\&CK Explorer dashboard providing a framework that helps you to contextualize runtime audits, manage them, and generate risk reports.
ATT\&CK Explorer is a knowledge base of tactics and techniques that adversaries use to attack applications and infrastructure. It’s a useful framework for threat-informed defense, where a deep understanding of adversary tradecraft can help protect against attacks.
The ATT\&CK framework has two key concepts:
* **Tactics** - An adversary’s technical goals.
* **Techniques** - How those goals are achieved or What they acheive
The relationship between tactics and techniques is presented as a matrix. One tactic in the matrix is called *Persistence*. After establishing a foothold in your environment, adversaries want to reliably return to it. Adversaries use a number of techniques to achieve persistence, such as *Account Manipulation* and *Event Triggered Execution*.
## Cloud Native threat matrix
Prisma Cloud protects cloud native applications running in Kubernetes clusters, serverless functions, Containers-as-a-Service offerings, and virtual machines. The Cloud Native threat matrix covers the different techniques that impact cloud native applications across all these environments. It’s composed from ATT\&CK for Linux, recent community efforts around ATT\&CK for Containers and Kubernetes, and a few techniques from Prisma Labs. The Cloud Native threat matrix is the foundation for the ATT\&CK dashboard.
## ATT\&CK dashboard
The ATT\&CK dashboard serves as a portal to the raw events in the **Monitor > Events** view. All Prisma Cloud audits are mapped to the tactics and techniques in the ATT\&CK framework. For example, when Defender detects a crypto miner in your environment, we map the audit to the *Resource Hijacking* technique under the *Impact* tactic.
The ATT\&CK dashboard collates audits, maps them to the tactics and techniques, and presents the data visually in the ATT\&CK matrix. Each card in the matrix shows a count of events. Higher counts represent a higher severity issues. Filters let you slice and dice the data to inspect specific segments of your environment. The dashboard:
* Presents a real-time view of tactics and techniques being employed by adversaries.
* Identifies weaknesses in your defenses. Use the counts to prioritize work to fortify defenses for the techniques favored by adversaries.
* Provides raw data for risk reports for management.
Audits from the following subsystems flow into the ATT\&CK dashboard:
* Container runtime audits.
* Host runtime audits.
* Serverless runtime audits.
* App-Embedded runtime audits.
* WAAS audits.
* Kubernetes audits.
* Admission (OPA) audits.
* Custom runtime rule audits for builtin system checks only. Currently, you cannot specify tactic and technique for user-defined custom runtime rules.
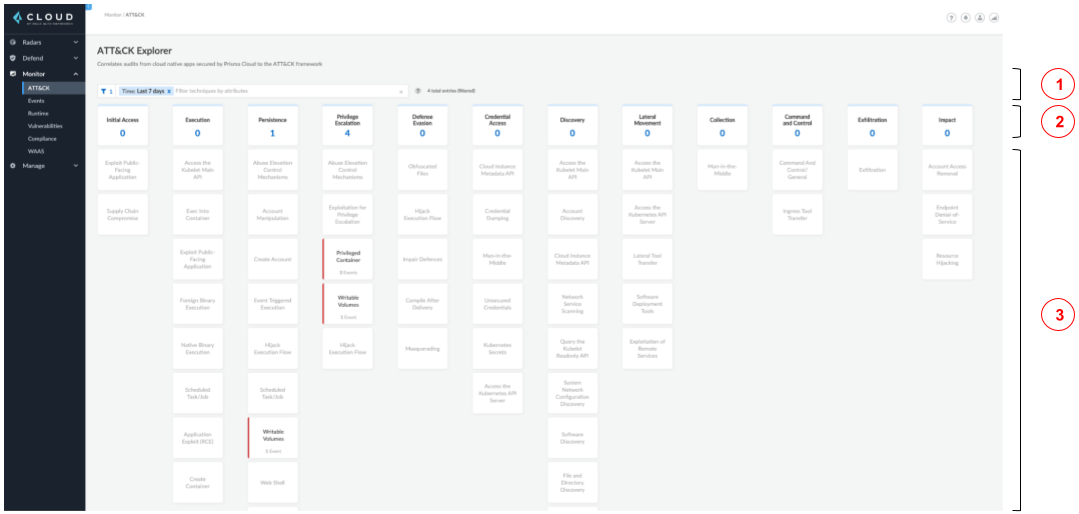
To see the ATT\&CK dashboard, open Console, and go to **Monitor > ATT\&CK**. The following screenshot highlights the main components in the dashboard:
**1. Filter** - Filter data in the dashboard by:
* **Impacted technique**.
* **Date**: View events that occurred in the past 24 hours, 7 days, 30 days, or 3 months.
* **Collection**: View data for just some segment of your environment (e.g., a production cluster).
**2. Tactics** - Tactics are listed across the top row of the matrix. A count shows the sum of all events for all corresponding techniques in the category. Each column lists the techniques that can be used to achieve the tactic.
**3. Techniques** - Lists of techniques that can be used to achieve a tactic. The color of the card is based on the event count for a technique. If there is one or more events for a technique, the card is colored red. Otherwise, if there are no events, the card is gray. All techniques are fully described [here](https://cdn.twistlock.com/docs/attachments/full_attack_explorer_matrix.pdf).
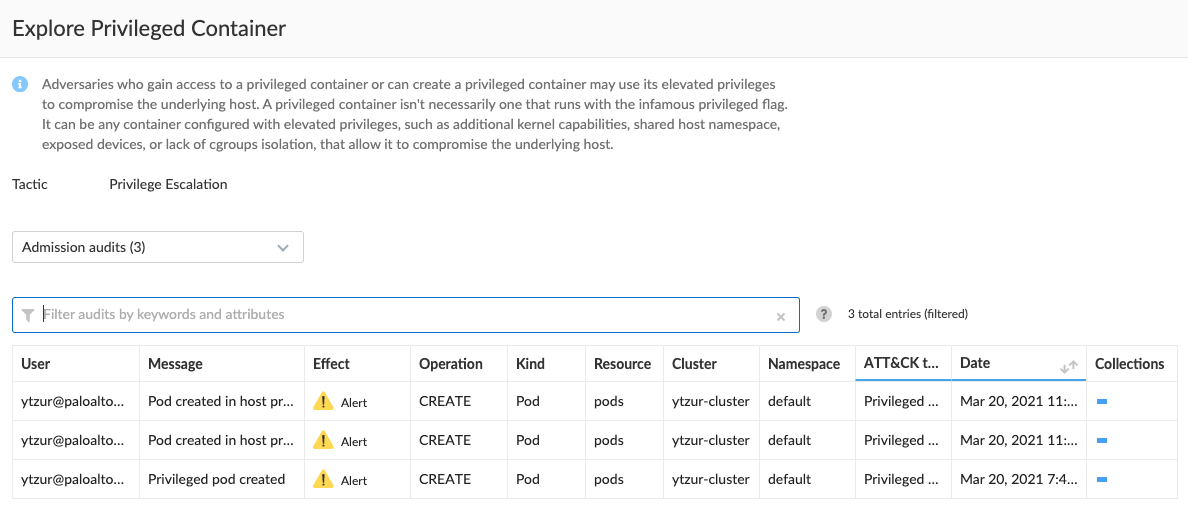
Clicking on an impacted technique card opens a dialog that shows all relevant audits for the technique.
The following screenshot shows the dialog for the *Privileged Container* card. The dialogs are organized as follows:
* Description.
* Audit source filter (pick from the drop-down list).
* Table of relevant audits.
Syslog messages contain tactic and technique information for all relevant audits.
## Investigating incidents
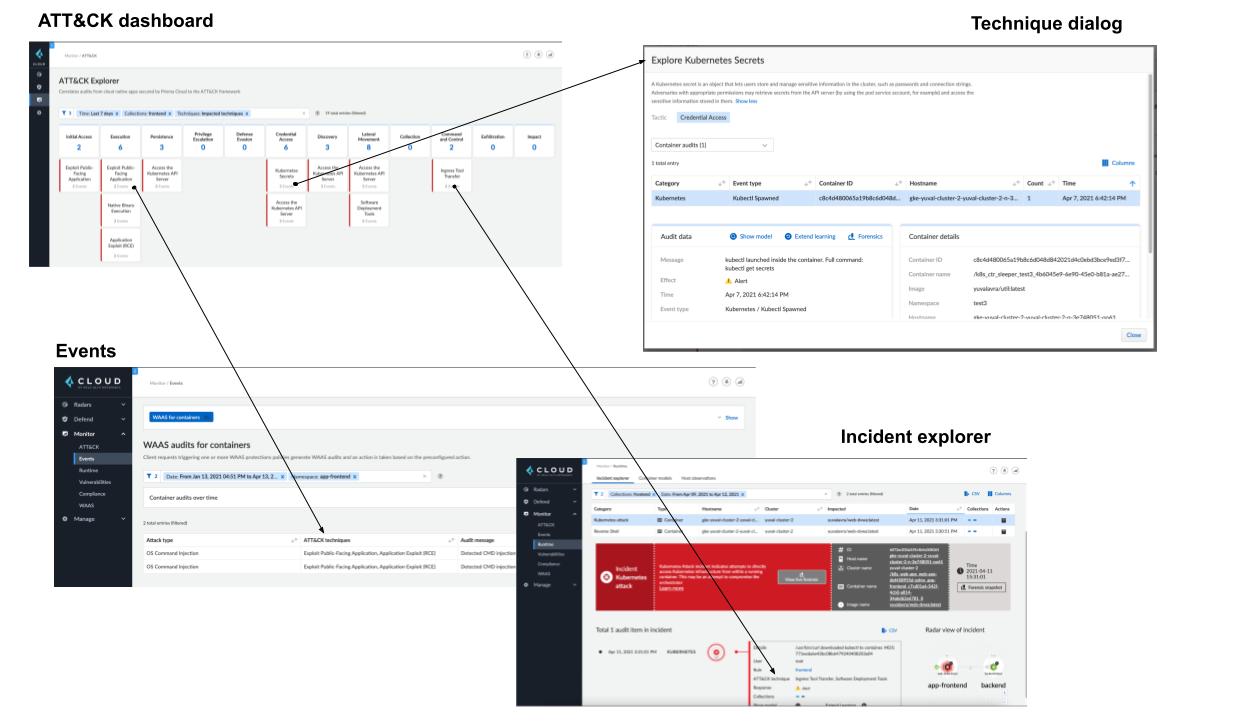
As you monitor your environment, you’ll see tactics and techniques are applied consistently across views. Tactics and techniques are shown in **Monitor > ATT\&CK**, **Monitor > Events**, and **Monitor > Runtime > Incident explorer**.
## Surfacing impacted techniques
When investigating an incident, you’ll want to focus on the segment of your environment that has been impacted. Use the filter box to focus your view of the data.
One important filter is **Impacted techniques**. Without the filter, all technique cards are displayed.
With the filter, only techniques that have been detected are displayed. In the following screenshot, we’ve narrowed the data to:
* Audits within the past seven days.
* Containers in the frontend collection, which are exposed to the Internet, and likely where the attack started.
* Attack techniques used by the adversary.
## Mapping audits to techniques
Every audit (for example, runtime, admission, and so on) maps to one or more techniques. The following table shows the mappings.
The **Techniques** column shows the technique to which an audit is always mapped.
The **Possible Additional Techniques** column shows the techniques that to which an audit can be optionally mapped, depending on changing information from the audit. For example, for some audits, on new files being created, we will check if the process that created the files is a compiler. If so, we also map the audit to the **Compile After Delivery** technique.
| Category | Audit Type | Techniques (techniques that the audit is always mapped to) | Possible Additional Techniques (techniques that the audit can optionally be mapped to, depending on changing information from the audit) |
| ---------------- | ------------------------------------------------------------- | --------------------------------------------------------------------- | ------------------------------------------------------------------------------------------------------------------------------------------------------------------------------------- |
| Cloud | cloudMetadataProbing | Cloud Instance Metadata API | - |
| Kubernetes | kubeletAPIAccess | Access Kubelet Main API | - |
| Kubernetes | kubeletReadonlyAccess | Query Kubelet Readonly API | - |
| Kubernetes | kubectlSpawned |
Access the Kubernetes API Server Software Deployment Tools
|
Lateral Tool Transfer Exec Into Container Create Container Kubernetes Secrets
System Credential Dumping System Account Discovery File And Directory Discovery System Unsecured Credentials Network Configuration Discovery Software Discovery
|
| - | unexpectedAPI | - | - |
| - | dos | Endpoint Denial-of-Service | - |
| - | searchEngineCrawler | - | - |
| - | businessAnalyticsBot | - | - |
| - | educationalBot | - | - |
| - | newsBot | - | - |
| - | financialBot | - | - |
| - | contentFeedClient | - | - |
| - | archivingBot | - | - |
| - | careerSearchBot | - | - |
| - | mediaSearchBot | - | - |
| - | genericBot | - | - |
| - | webAutomationTool | - | - |
| - | webScraper | - | - |
| - | apiLibrary | - | - |
| - | httpLibrary | - | - |
| - | sessionValidation | - | - |
| - | javascriptTimeout | - | - |
| - | missingCookie | - | - |
| - | browserImpersonation | - | - |
| - | requestAnomalies | - | - |
| - | userDefinedBot | - | - |
| - | GKE - pod created in host process namespace | Privileged Container | |
| - | GKE - pod created with host file system mount | - | - |
| - | GKE - pod created without security context | - | - |
| - | GKE - pod created on host network | Privileged Container | - |
| - | GKE - privileged pod creation | Privileged Container | - |
| - | GKE - Forbidden request | - | - |
| - | GKE - exec or attach to a pod | Exec Into Container | - |
| - | Twistlock Labs - GKE - Tampering with Twistlock configuration | Impair Defences | - |
| - | Pod created in host process namespace | Privileged Container | - |
| - | Pod created with host file system mount | - | - |
| - | Pod created without security context | - | - |
| - | Pod created on host network | Privileged Container | - |
| - | Privileged pod creation | Privileged Container | - |
| - | Forbidden request | - | - |
| - | Exec or attach to a pod | Exec Into Container | - |
| - | Twistlock Labs - Tampering with Twistlock configuration | Impair Defences | - |
| - | CIS - Privileged pod created | Privileged Container | - |
| - | CIS - Pod created in host process ID namespace | Privileged Container | - |
| - | CIS - Pod created on host IPC namespace | Privileged Container | - |
| - | CIS - Pod created on host network | Privileged Container | - |
| - | CIS - Privilege escalation pod created | Privileged Container | - |
| - | Pod created with sensitive host file system mount | Writable Volumes | - |
| - | Exec or attach to a pod | Exec Into Container | - |
---
# Agent Instructions
This documentation is published with GitBook. GitBook is the documentation platform designed so that both humans and AI agents can read, navigate, and reason over technical content effectively. Learn more at gitbook.com.
## Querying This Documentation
If you need additional information that is not directly available in this page, you can query the documentation by asking a question.
Perform an HTTP GET request on the following URL with the `ask` and `goal` query parameters:
```
GET https://docs.prismacloud.io/admin-guide/runtime-defense/attack.md?ask=&goal=
```
`ask` is the immediate question: it should be specific, self-contained, and written in natural language.
`goal` is what the user is ultimately trying to achieve, the reason they need the answer. Sharing it helps GitBook give you a better, more relevant answer. A goal is most helpful when it describes the outcome the user wants rather than restating the question. For example, with `ask=how do I create an API token`, a goal like `automate deployments from our CI pipeline` lets GitBook tailor the answer to that use case.
The response will contain a direct answer to the question and relevant excerpts and sources from the documentation.
Use this mechanism when the answer is not explicitly present in the current page, you need clarification or additional context, or you want to retrieve related documentation sections.