> For the complete documentation index, see [llms.txt](https://docs.prismacloud.io/llms.txt). Markdown versions of documentation pages are available by appending `.md` to page URLs; this page is available as [Markdown](https://docs.prismacloud.io/admin-guide/web-application-and-api-security-waas/waas-analytics.md).
# Analytics
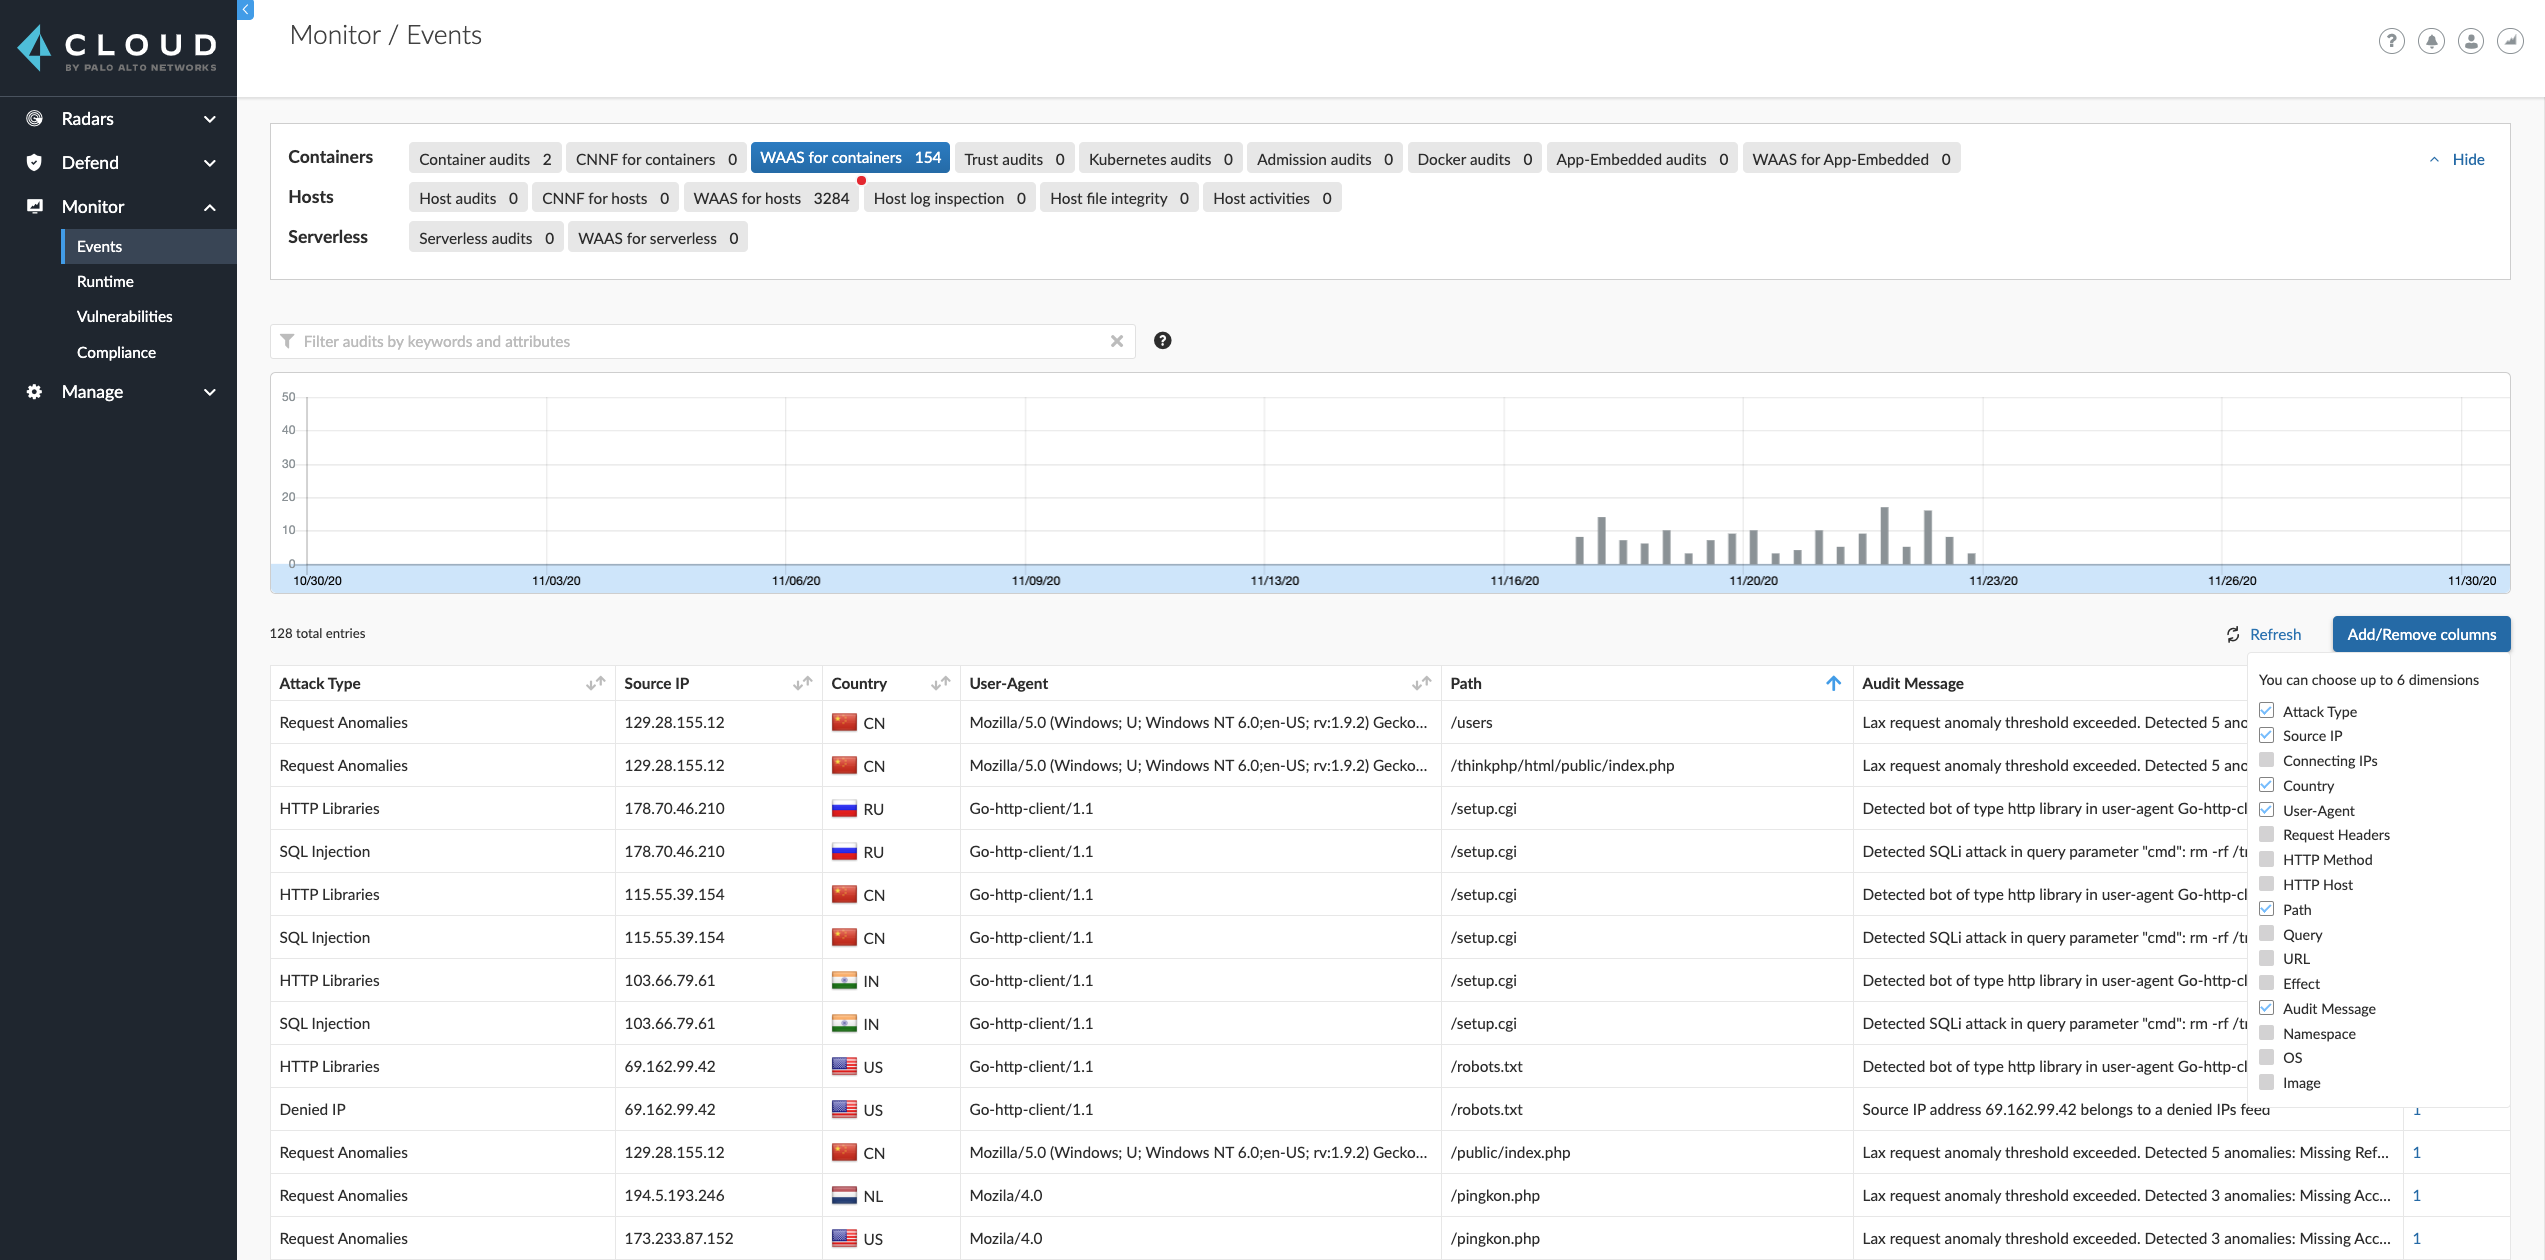
WAAS analytics provide users a way to investigate events and rule triggers.
* For container WAAS events go to **Monitor > Events > WAAS for containers**
* For host WAAS events go to **Monitor > Events > WAAS for hosts**
* For App-Embedded WAAS events go to **Monitor > Events > WAAS for App-Embedded**
* For serverless WAAS events go to **Monitor > Events > WAAS for Serverless**
WAAS retains up to 200,000 events for each type (container, hosts, app-embedded and serverless) or or a total of 200MB in log size. Once the limit is reached, oldest events will get over-written by new ones.
Similar audits are aggregated and grouped into a single event when received in close succession (less than 5 minutes apart). Audits are aggregated by a combination of IP, HTTP hostname, path, HTTP method, User-Agent and attack type.
## Analytics workflow
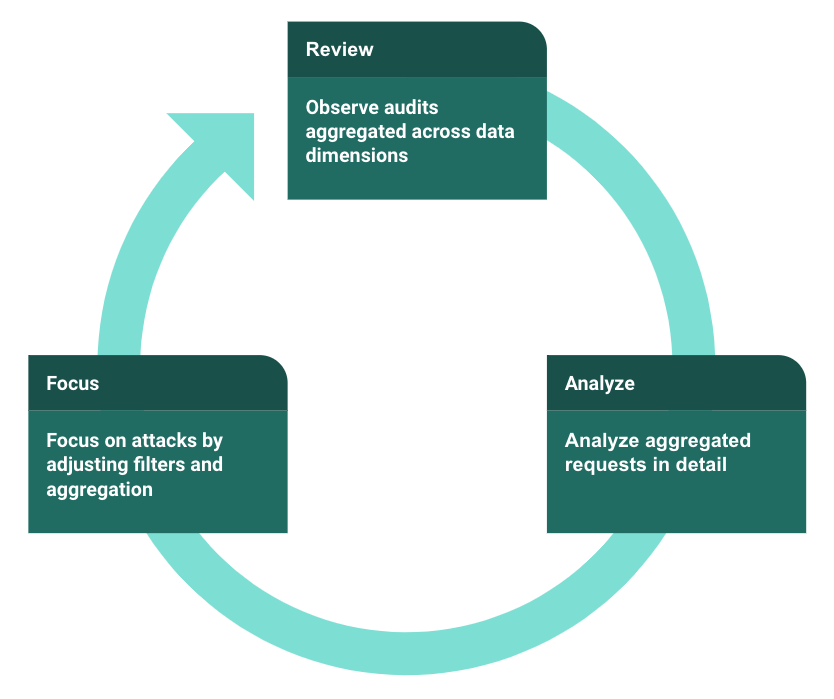
WAAS analytics allows for the review of incidents by analyzing events across various dimensions, inspecting individual requests, and applying filtering to focus on common characteristics or trends.
## Event graph
A timeline graph shows the total number of events. Each column on the timeline graph represents a dynamic period - hover over a column to reveal its start, end and event count.
The date filter can be adjusted by holding and selecting sections on the timeline graph.
## Filters
Filter can be adjusted by using the filtering line:
The filter line uses auto-complete for filter names and filter values. Once set, the filters would apply on the graph and aggregation view.
You can dynamically update the date filter by selecting an area in the chart. Click in the chart area, hold the mouse button down, and draw a rectangle over the time frame of interest. The date filter is automatically updated to reflect your selection.
## Aggregation view
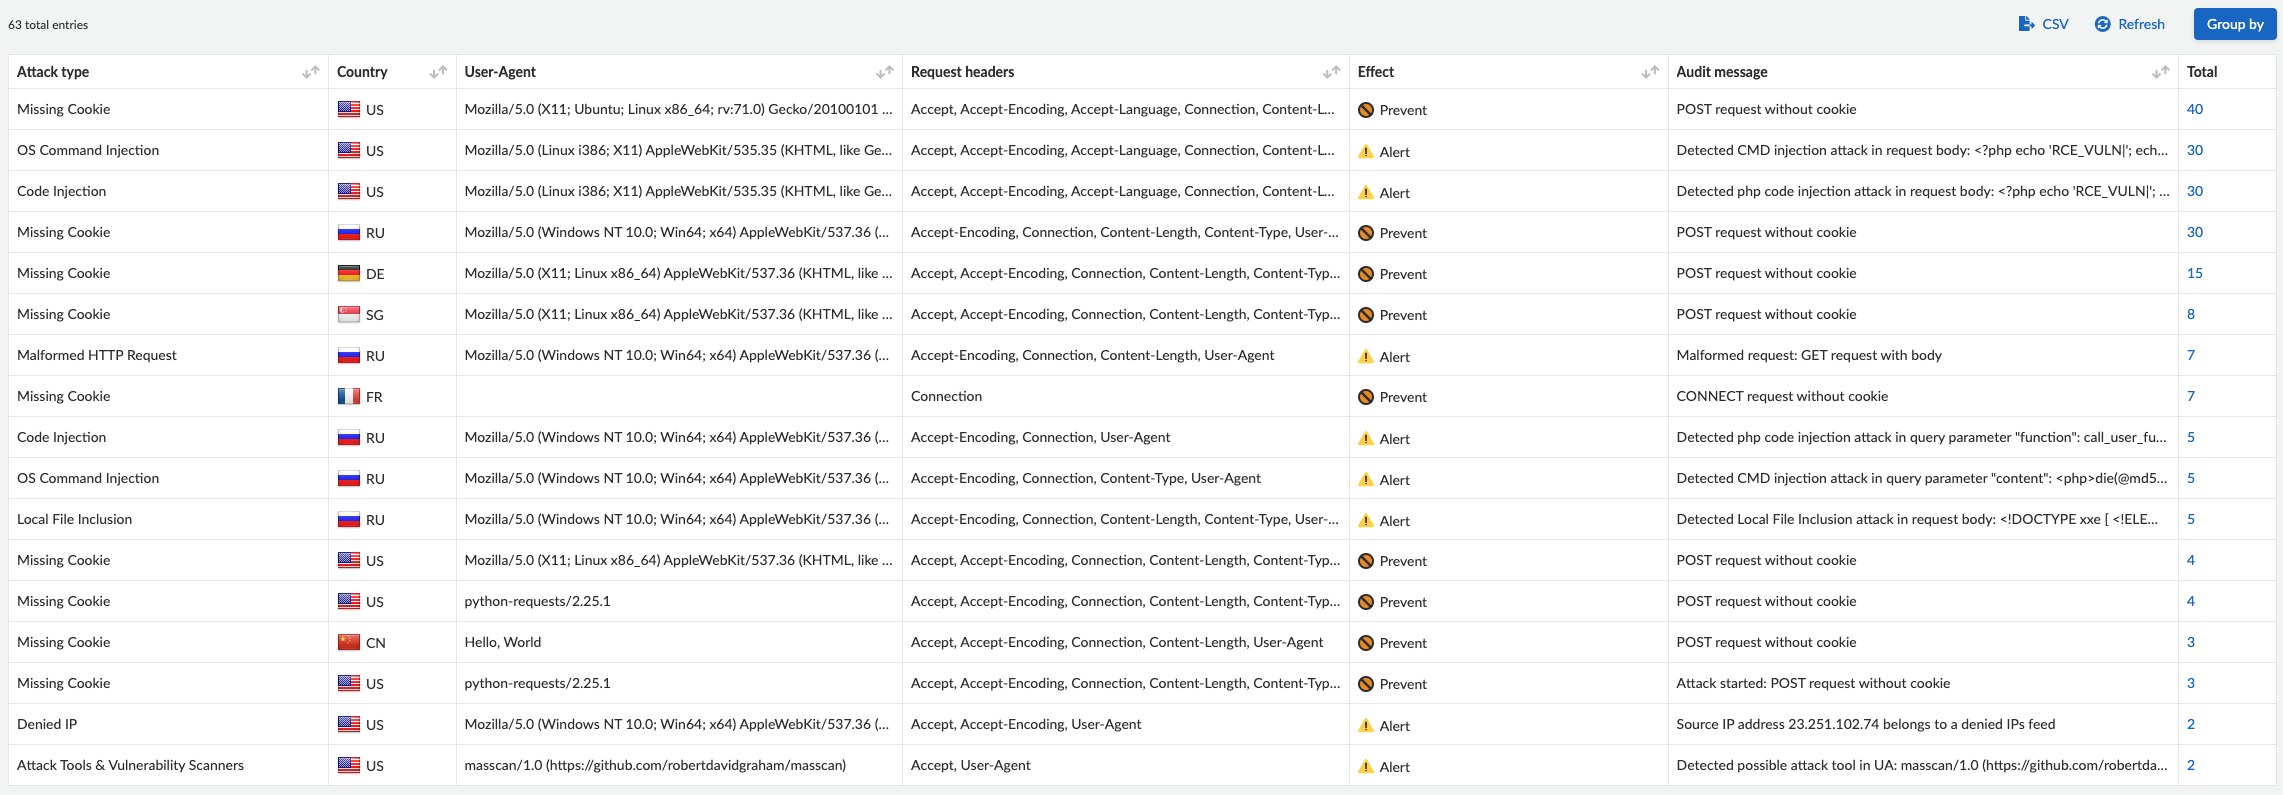
The aggregation view can be altered to group audits based on various data dimensions by clicking on the button.
Users can add up to 6 dimensions to the aggregation and the Total column will be updated dynamically.
By default, aggregation view is sorted by the "Total" column. Sorting can be changed by clicking a column name.
Click on a line in the aggregation view to inspect the requests group by it.
## Request view
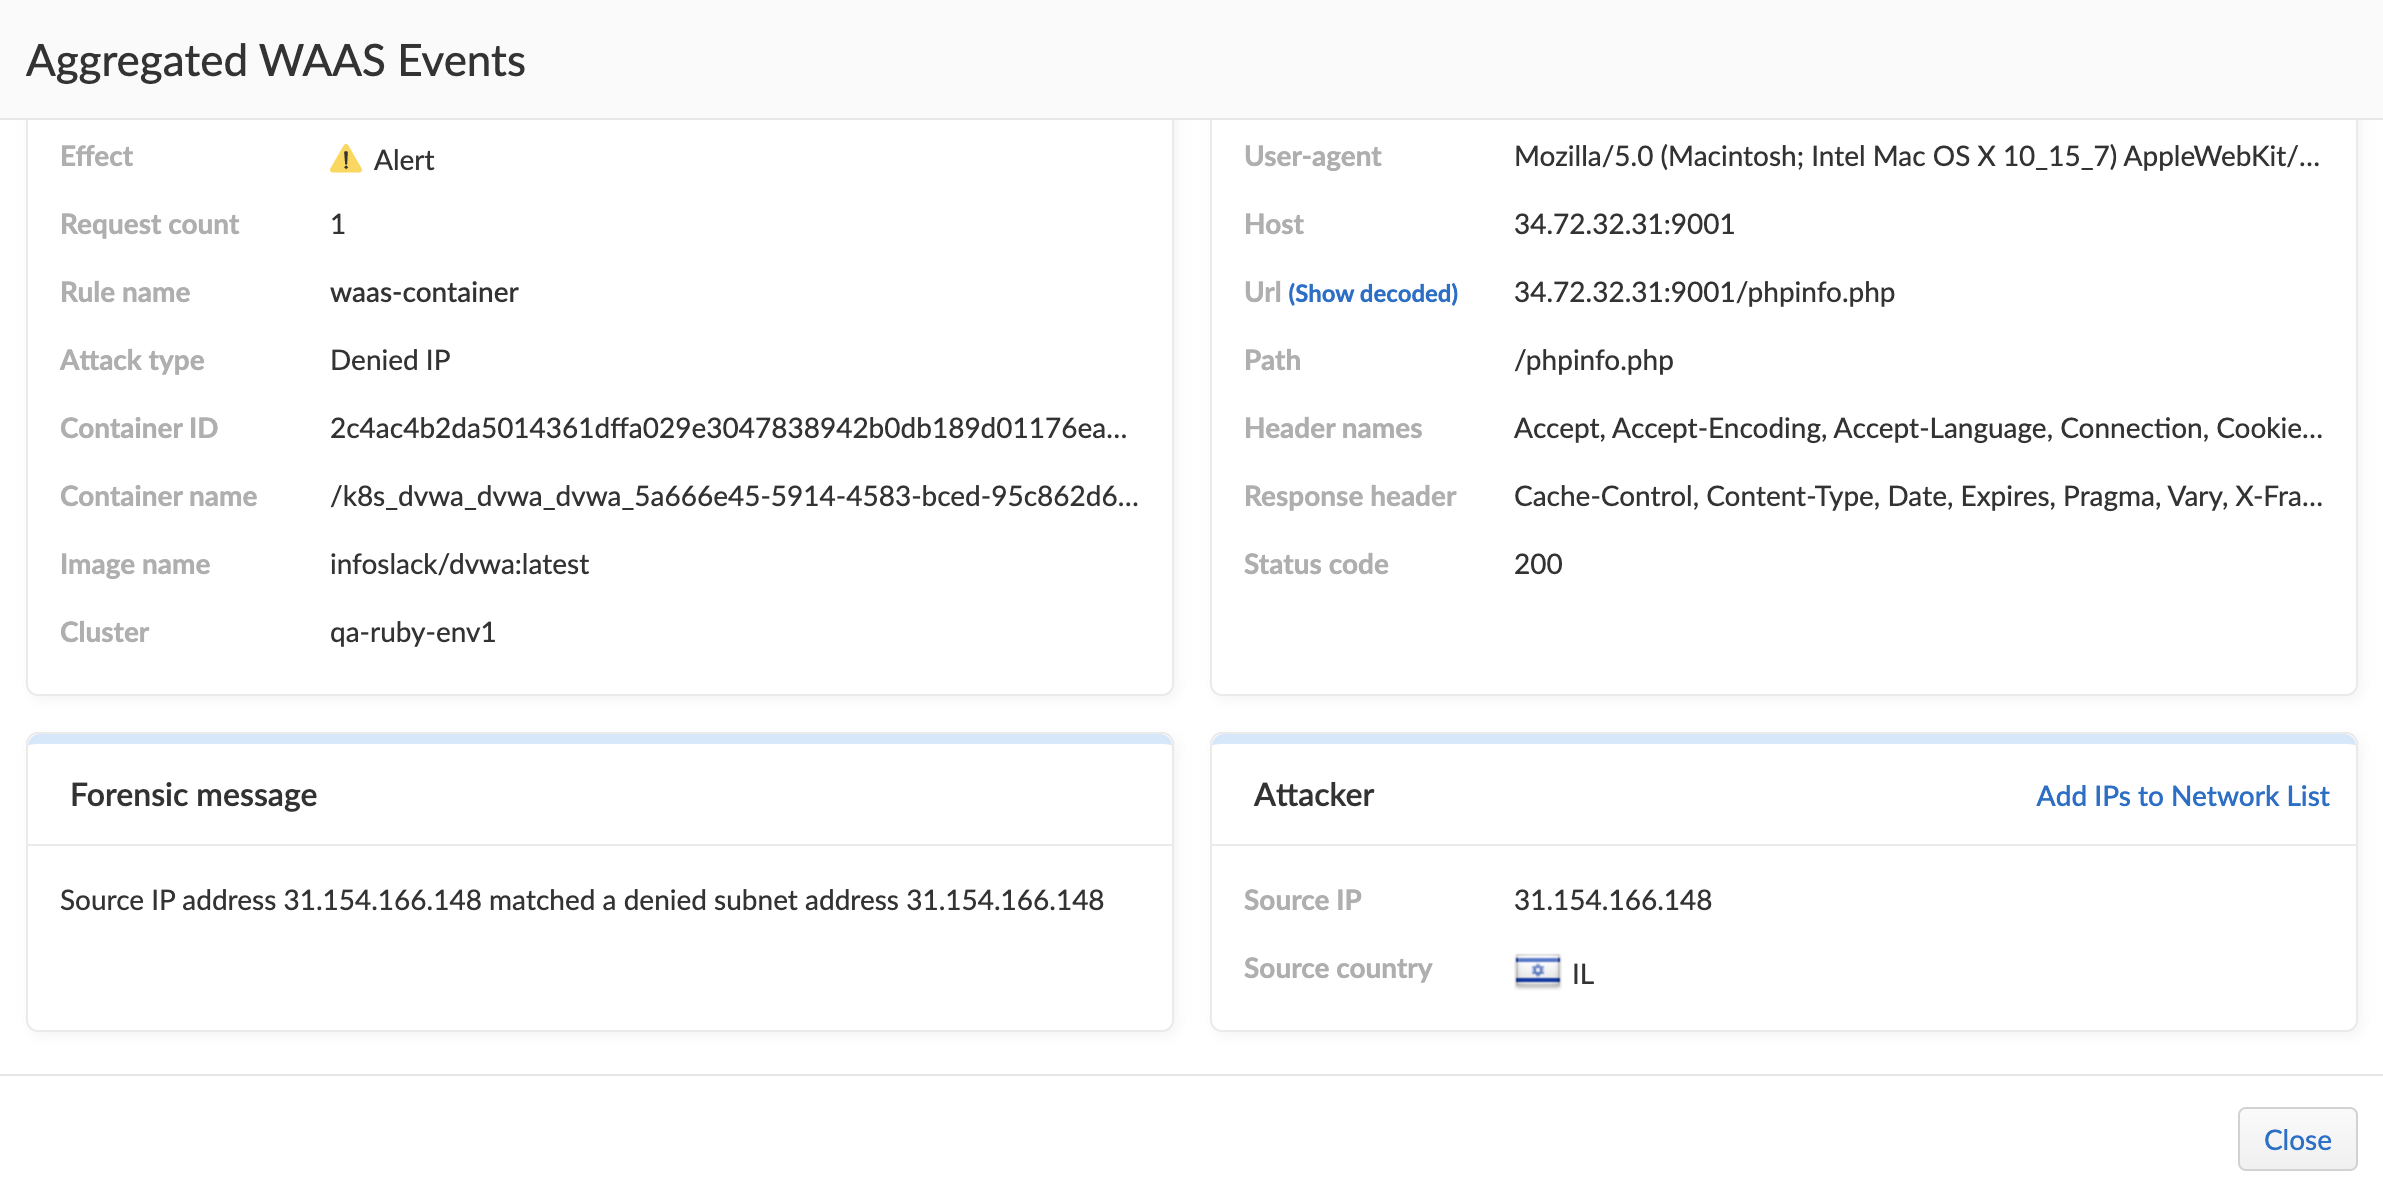
Request view details all of the requests group by each line of the aggregated view.
Clicking on a column name will sort the table in the upper section and using the button will add/remove columns.
For each request the following data points are available:
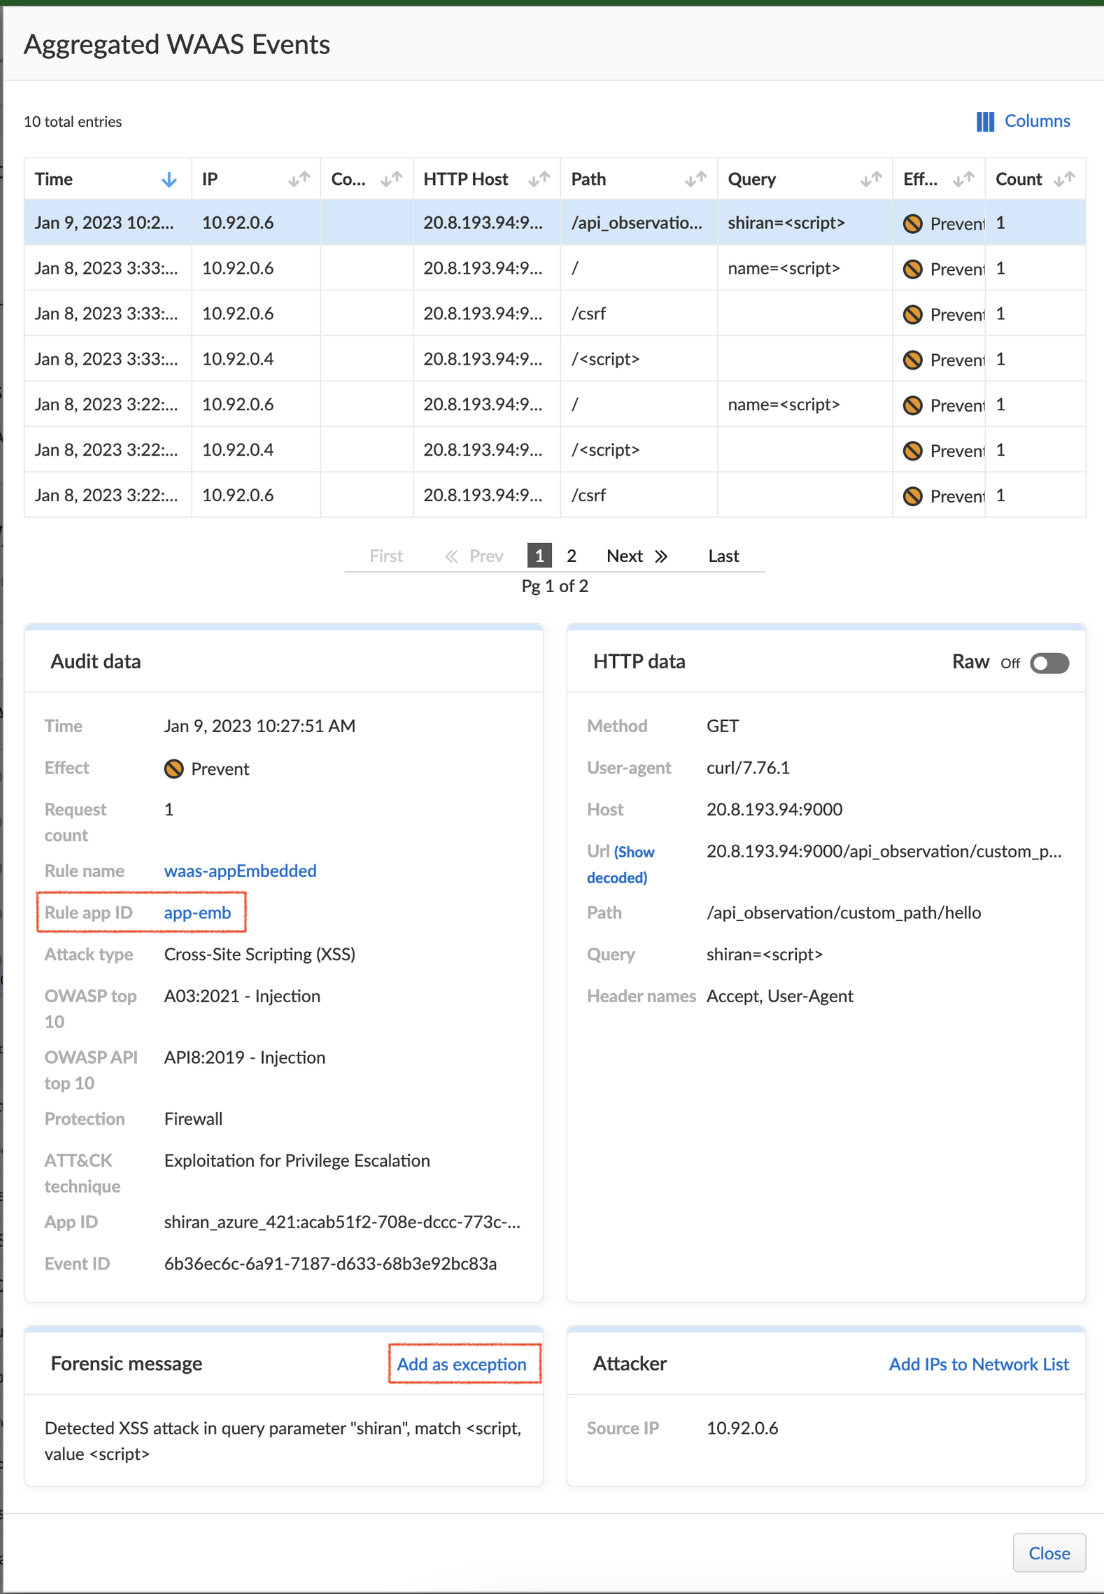
**Audit data:**
* **Time** - timestamp of the audit.
* **Effect** - effect set by policy.
* **Request Count** - If audits are received in close succession (less than 5 minutes apart) they are aggregated and grouped into one event. This field specifies the number of aggregated requests.
* **Rule Name** - name of the WAAS rule that matched the request and generated the event. Navigate to the configuration of the rule by clicking on the link.
* **Rule app ID** - corresponding app ID in the WAAS rule which triggered the event. Navigate to the configuration of the app ID by clicking on the link.
* **Attack Type** - attack type.
* **ATT\&CK technique** - mapping to the techniques in the ATT\&CK framework.
* **Container / Host / App / Function Details** - These fields include the id and name of the protected entity.
**Forensics:**
* **Forensic Message** - details on what caused the rule to trigger - payload content, location and additional relevant information.
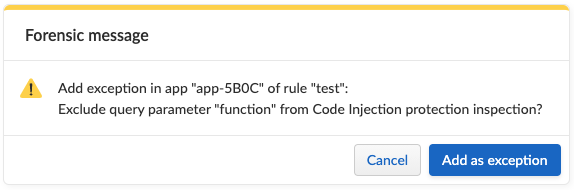
* **Add as exception** - By clicking on the link, you can add an exception in the rule app ID for the attack type that triggered. The exception will be based on the location of the matched payload.
The "Add as exception" link may not be available for events created by rules and apps that no longer exist, as well as for events created in releases earlier than 21.08.
For App-Embedded WAAS events, the **Add as exception" button does not allow you to add an exception directly from an event. You can manually add exceptions to rules. Click the \*Rule app ID** on the "Aggregated WAAS Events" page and edit the relevant detection.
**HTTP request:**
* **Method** - HTTP method used in the request.
* **User-Agent** - value of the User-Agent HTTP header.
* **Host** - hostname specified in the `Host` HTTP header or the host part of the URL.
* **URL** - full request urls (host and path) shown in a URL decoded or encoded form.
* **Path** - path element from the request URI.
* **Query** - query string.
* **Header Names** - list of the HTTP header names included in the request (sorted alphabetically).
**Attacker:**
* **Add IPs to Network List** - Adds the attacker IP either to a new network list or to an existing one. To access **Network Lists**, open Console, go to **Defend > WAAS** and select the **Network List** tab.
* **Source IP** - IP address from which the request originated. If an `X-Forwarded-For` header was included in the HTTP headers, source IP field will detail the first IP listed in the header value (true client IP).
* **Source Country** - source country associated with the source IP.
* **Connecting IPs** - entire connectivity chain, including true client IP and any transparent proxies listed in the HTTP request.
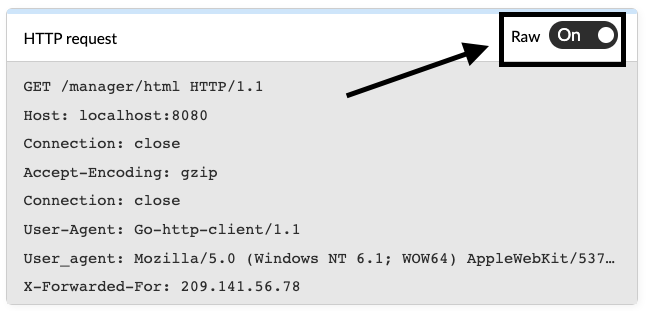
Users can user the `Raw` button to view the HTTP request in it’s raw form:
---
# Agent Instructions
This documentation is published with GitBook. GitBook is the documentation platform designed so that both humans and AI agents can read, navigate, and reason over technical content effectively. Learn more at gitbook.com.
## Querying This Documentation
If you need additional information that is not directly available in this page, you can query the documentation by asking a question.
Perform an HTTP GET request on the following URL with the `ask` and `goal` query parameters:
```
GET https://docs.prismacloud.io/admin-guide/web-application-and-api-security-waas/waas-analytics.md?ask=&goal=
```
`ask` is the immediate question: it should be specific, self-contained, and written in natural language.
`goal` is what the user is ultimately trying to achieve, the reason they need the answer. Sharing it helps GitBook give you a better, more relevant answer. A goal is most helpful when it describes the outcome the user wants rather than restating the question. For example, with `ask=how do I create an API token`, a goal like `automate deployments from our CI pipeline` lets GitBook tailor the answer to that use case.
The response will contain a direct answer to the question and relevant excerpts and sources from the documentation.
Use this mechanism when the answer is not explicitly present in the current page, you need clarification or additional context, or you want to retrieve related documentation sections.