> For the complete documentation index, see [llms.txt](https://docs.prismacloud.io/llms.txt). Markdown versions of documentation pages are available by appending `.md` to page URLs; this page is available as [Markdown](https://docs.prismacloud.io/content-collections/alerts/view-respond-to-prisma-cloud-alerts.md).

# View and Respond to Prisma Cloud Alerts

Alerts on Prisma Cloud are generated to identify a range of potential threats, each corresponding to a specific policy type in the console. An alert is created when Prisma Cloud detects a violation in a policy that is included in an active alert rule. These alerts are classified as incidents and risks.

If you are already on **Alerts**, you are at the right place. The Alerts are prioritized and organized into specific saved views to help you easily access the most urgent and pertinent alerts for a focus area. Each saved view is named and has preset filters to display the relevant alerts. For example, the Overview displays all open alerts within the past 24 hours, while Highest Priority displays open alerts for critical and high severity policies that were opened within the past 24 hours. If you have a specific category of alerts in mind, you’ll find them grouped in categories such as vulnerability or malware.

Alternatively, starting from the **Home** page (with the Prisma Cloud switcher set to Cloud Security) provides you with an overview of incidents and high-priority risks detected in the last 24 hours. From the Home page also, you are back on the **Alerts** from where you can take immediate action, such as exploring attack paths and delving into alerts associated with critical and high-severity policies. This allows you to focus on threats with the highest risk potential.

Effective management of alerts is crucial for safeguarding your cloud environments. You have two options: you can either monitor and take action from the Prisma Cloud or you can [Send Prisma Cloud Alert Notifications to Third-Party Tools](/content-collections/alerts/send-prisma-cloud-alert-notifications-to-third-party-tools.md#idcda01586-a091-497d-87b5-03f514c70b08) where you have automated processes or workflows for timely response and resolution.

This section helps you with how to view and take action on **Alerts** from the Prisma Cloud console.

## Alert States

The status of an alert can be one of the following:

* **Open**—Prisma Cloud identified a policy violation that triggered the alert and the violation is not yet resolved.
* **Pending Resolution**—If you enabled an alert rule with Auto Remediation for Config policies that are remediable or Attack Path policies, the alerts is marked with pending\_resolution which is an interim state. As soon as the CLI is executed and the resource misconfguration is addressed, the alert transitions from the **Pending Resolution** state to the **Resolved** state.
* **Resolved**—When the issue that caused the policy violation is resolved, alerts automatically transition to the Resolved state. Some other reasons for when an alert can transition to the Resolved state include a change in the policy or alert rule that triggered the alert, or when a cloud account with an automatically created account group is modified and re-attached to an account group that you created manually. A resolved alert can also transition back to the open state if the issue resurfaces or there is a policy or alert rule change that causes the alert to trigger again. When the violation for a given alert has been resolved, it may take up to 24 hours for the alert to transition to the **Resolved** state.
* **Snoozed**—A Prisma Cloud administrator temporarily dismissed an alert for a specified time period. When the timer expires, the alert automatically changes to an Open or Resolved state depending on whether the issue is fixed.
* **Dismissed**—A Prisma Cloud administrator manually dismissed the alert even though the underlying issue was not resolved. You can manually reopen a dismissed alert if needed. Alerts that are manually dismissed remain in the **Dismissed** state even when the same policy violation happens again.

  Depending on volume of alerts, the time to update the status of an alert can vary when you update an alert rule. For example, if you remove a policy from an alert rule, all open alerts will transition to a resolved state and the time to reflect this change on the interface can depend on the number of corresponding alerts. In addition, when you modify an alert rule, and the conditions that triggered the alert are no longer valid, the alert is updated as **Resolved**.

  Bulk editing actions to resolve, dismiss, or snooze alerts take a while to reflect the updated status.

## View Alerts on the Prisma Cloud Console

An alert is an issue that needs your attention. It informs you about an asset with a potential problem such as a misconfiguration, exposure to the internet or malware. Alerts are grouped into saved views and the most critical issues are priortitized and arranged from left to right.

Each saved view is system-defined and has a default name and preset filters to display the relevant alerts. For instance, **Overview** displays all open alerts within the past 24 hours and **Highest Priority** displays open alerts for critical and high severity policies that were opened within the past 24 hours.

When you view an alert, you have context on the alert itself that includes the impact as displayed by the different finding types and the details on the issue that triggered the violation. For some policy types, such as Attack Path policies that combine multiple security signals to identify an incident, you can also use the evidence graph to visualize the impact.

In addition to the alert context, you also have context on the asset such as information on the host, IAM details, Attack Path graphs, and relationships with other assets to help you understand other associations.

**NOTE:**

The time to alert varies for different alert types and occasionally may take a few hours depending on various factors such as, ingestion frequency, detection mechanism, and so on.

1. Select **Alerts** to view alerts from within Prisma Cloud.

   Prisma Cloud displays all alerts for which your role has permissions. For each saved view the filters determine what you see on the page. You can Add or update filters. With the exception of the Overview, when you modify the filters in a system-defined view, you can either copy to a new view to save changes or clear edits. Any custom view is prefixed with a custom view icon.
2. To show, hide, and reorder the columns to suit your preferences, click the column picker icon and add, remove columns, and change the order of columns.
3. To sort on a specific column, click the corresponding **Sort** icon.

   Most filters have a value you can select in the dropdown, and some such as the Asset Tag support a key and value as input. It performs an exact match, and does not support white spaces or wildcard characters. You can for example, enter Key as `env` and leave the Value as empty to match on all values for the key `env`, or specify value as `prod` or `stage`.

   The filters act as a union (OR) operator to combine the results from multiple selections within a filter and the intersection (AND) operator across different filters. The exception to this behavior is the combination of the Cloud Account with Account Group filter, and the Cloud Account with Cloud Account Name filter which use the OR logic instead of AND logic across different filters.
4. Use the Group By and Sort By to modify how you prefer to see the alerts.

   By default, the alerts are grouped by policy name and sorted by severity so that you can quickly see the most severe violations and the count of issues.

   Except when grouped by policy name, each row displays the total number of policies, the total number of alerts and the number of critical and high severity alerts and the different cloud environments in which these alerts were generated.
5. Select a specific policy name to view the details on the asset on which the alert was generated, the alert ID, alert time, the account name and ID, and additional details.

   Select the asset name link to open the side panel and review the rich asset metadata, including the JSON configuration (**\*View Config**) for the asset.

   To view the details for the asset on the Cloud Service Provider directly, select the **View in Console** link next to the asset name.

   Select the alert ID link to open the side panel and review the alert details.
6. As needed, **Download** the filtered list of alert details to a CSV file.

   When you add a cloud account on Prisma Cloud and then delete it, you can no longer view alerts associated with that account on **Alerts > Overview** and the alert count does not include alerts for a deleted cloud account.

**NOTE:**

* Cloud account deletion from Prisma Cloud: When you delete a cloud account, all associated data, including alerts, are retained for an additional 24 hours, after which they are permanently deleted. If you accidentally delete an account, you can restore it within 24 hours and recover all associated data.
* Asset deletion from a cloud account onboarded on Prisma Cloud: Asset configurations are retained on Prisma Cloud for 60 days after the assets data is deleted.

## Alerts Actions

Effectively managing and responding to alerts is crucial for maintaining the security and integrity of your cloud environment. After you [view alerts](#view-alerts.adoc), you can take action and manage alerts in a few different ways on Prisma Cloud.

* **Dismiss**—When you select an open alert, and determine that it is not an issue that you want to monitor and want to ignore, you can dismiss it with a reason.
* **Snooze**—When you select an open alert that you want to temprarily dismiss, you can set a snooze duration and a reason. Alerts and notifications will be suppressed for the specified time period.
* **Remediate**—Automated remediations with CLI; and is the same action as Remediate. To remediate issues with the Fix in Cloud, Prisma Cloud requires limited read-write access to your cloud accounts. With the correct permissions, Prisma Cloud can automatically run the CLI command required to remediate the policy violation directly on your cloud platform. Because the action to remediate requires you to assess each alert individually and ensure that it is the appropriate action, you cannot enable automatic remediation for multiple alerts as a bulk action.
* **Reopen**—You can reopen a dismissed alert or a snoozed alert before the snooze period expires, if you want to review and investigate it.
* **Investigate**—When you select an open alert for some policy types such as Config or IAM policies that use RQL, you get an automatically generated search query that enables you to review the details for the alert on **Investigate**. The ability to investigate is also available from the Alert side panel.
* **Send to Jira**—When you select the Alert ID link for an alert that is in a snoozed or open state, you can send the alert to your Jira integration. This option enables you to create and assign an action to a user and help them track status in their existing workflows. If the user who set up your Jira integration is no longer with your organization, you have to create a new [Jira integration](/content-collections/administration/configure-external-integrations-on-prisma-cloud/integrate-prisma-cloud-with-jira.md).
* **Send to Email**—When you select the Alert ID link for an alert that is in a snoozed or open state, you can send the alert as an email for the authorized person or team to review and remediate.
* **Send to Slack**—When you select the Alert ID link for an alert that is in a snoozed or open state, you can send the alert to a Slack channel of your organization to review and remediate.
* **View in Console**—When you select the Alert ID link for an alert, the View in Console link takes you to the Cloud Service Provider console where the asset is deployed. If you have access to the CSP console, you can log in and view the details of the misconfiguration that generated the policy violation.
* **View Config**—View a snippet of the asset configuration in a JSON format. This view enables you to review the configuration directly on the Prisma Cloud console.
* **View Details**—Takes you to **Runtime Security > Monitor > Vulnerabilities**

Some additional options that you can access when you select the **Asset Name** link in an alert and access the Asset side panel are:

* **Fix in Cloud**—Same as **Remediate**, and it uses the automated remediation with CLI. This option is only available for misconfigurations when you can access the evidence graph for an alert.
* **Fix in Code**—Submit a Pull Request (PR) for IaC misconfigurations and package CVEs based on the fix recommendation in the policy that triggered the alert. To completely resolve the issue, you need to access the PR on the VCS console and merge the fix with the default branch.
* **Manual Fix**—Enables you to trace the source of the issue that triggered the policy violation. You get a link to the lines of code for the resource or package, so you can review the resource block with the configuration issue and take action in your version control system/repository. Manual fix is best suited for issues that do not have a fix recommendation in policy.
* **Suppress**—Enables you to suppress a package CVE that does not impact your environments or compliance needs. This hides the issue from being reported as a finding in your monitored assets.
* **Suggest Least Privilege Access**— When an asset has an identity attached to it, for example an IAM role that grants access to an EC2 instance, on **Identity** tab of the asset sidecar you can configure least privilege access. You can define a time when unused permissions attached to the asset will be considered as over permissive, and get a suggestion for right-sizing permissions. The new set of permissions are based on existing configuration used by all identities attached to the asset. See [suggest least privilege access](https://github.com/PaloAltoNetworks/pc-docs-md/tree/main/enterprise-edition/content-collections/administration/configure-iam-security/cloud-identity-inventory.md).

<figure><img src="/files/5t4fNcQ0A2zexOSFpEdI" alt="alerts darwin actions"><figcaption></figcaption></figure>

If an Alert rule has Auto Dismiss enabled for a given policy, Prisma Cloud will prevent the creation of another Alert rule using the same policy with a different Auto Action, even if the target scopes or account groups differ. This behavior is by design to avoid overlaps, that may cause both rules to apply to the same resource.

**Workaround**—If you wish to use both Auto Dismiss and Auto Remediation for the same policy, you can clone the policy and configure each alert rule separately. Alternatively, use a single Alert rule to enable Auto Remediation and exclude the accounts where you wish to use Auto Dismiss.

## Triage Alerts

Prisma Cloud generates an alert each time that it finds policy violations in one or more of the account groups that are associated with an alert rule. You can monitor alerts in the cloud accounts for which you are responsible to see any security risks you have and to ensure that any critical issues get *resolved* or *remediated*. An alert is resolved when the underlying conditions that generated the alert are fixed or changed such as when the resource is no longer being scanned or the policy is no longer in effect.

1. **Take action on a alert**

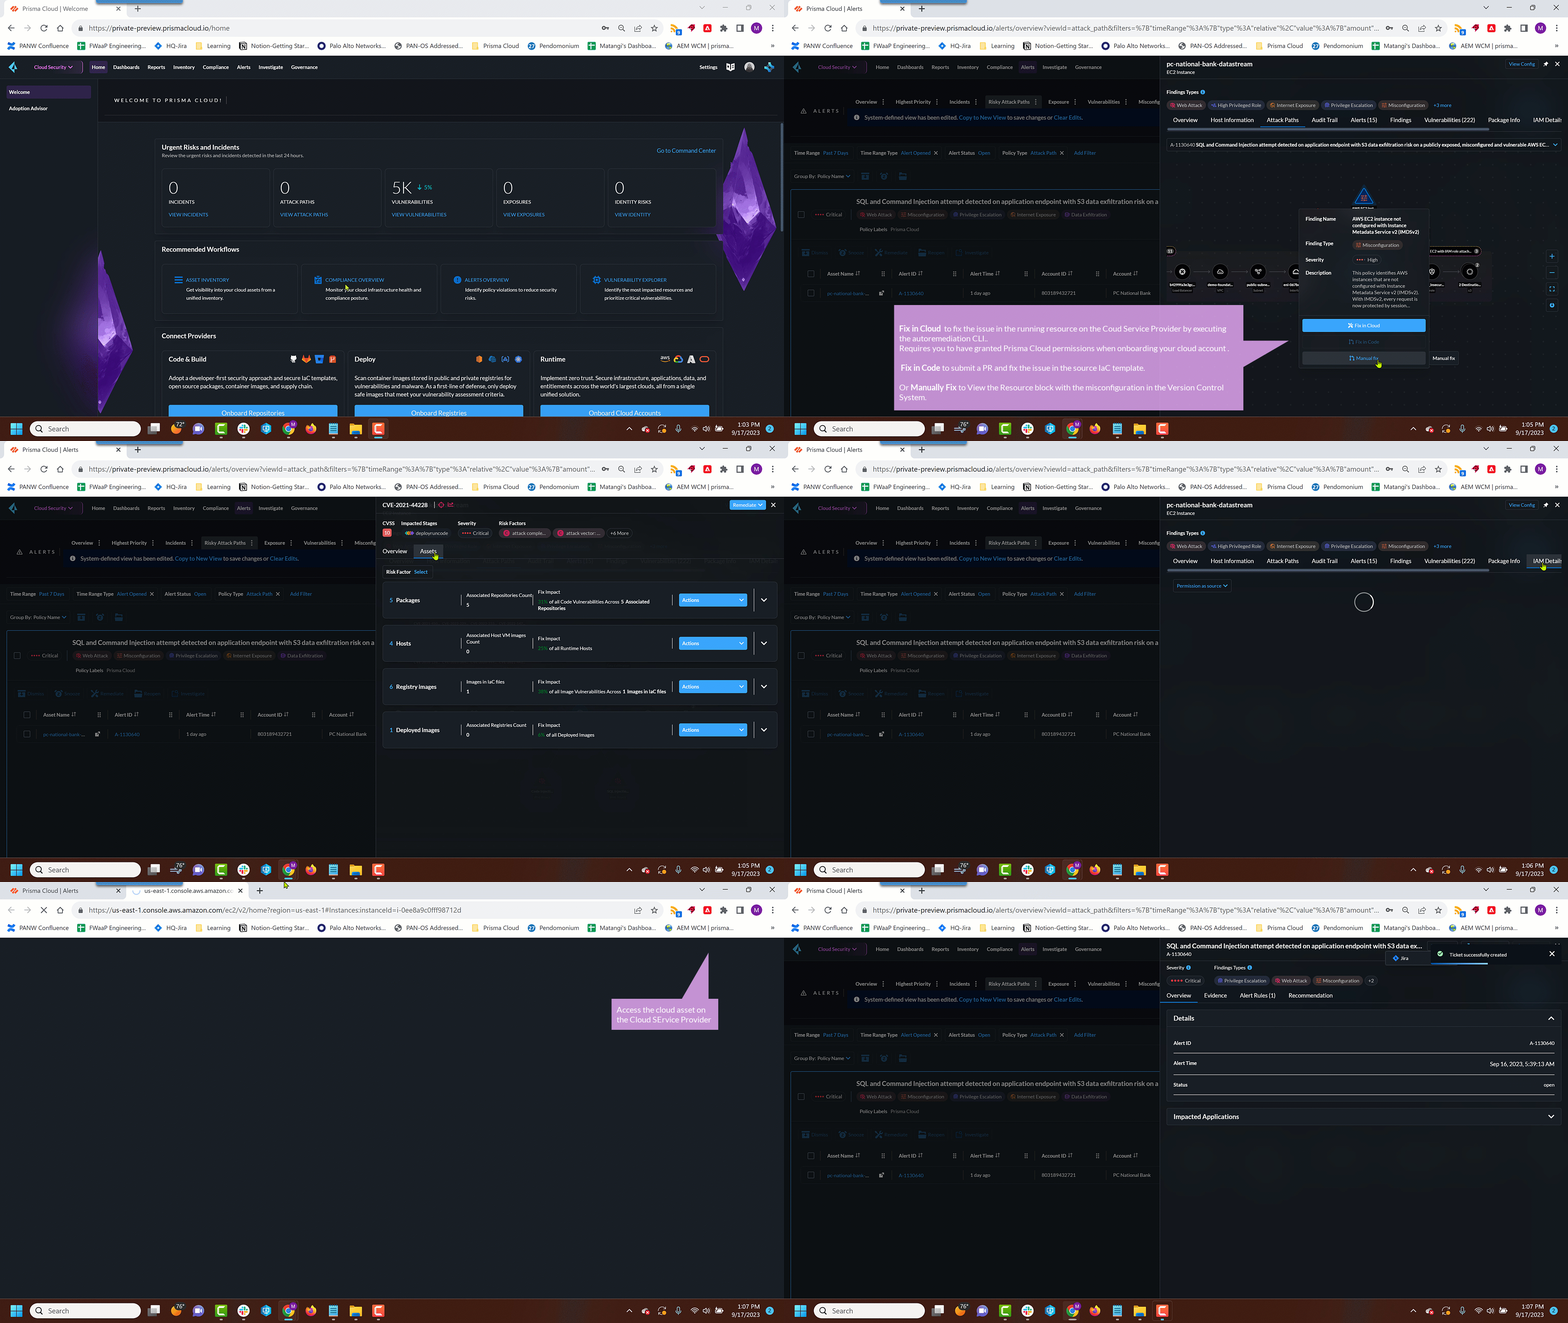
   In this example workflow, you can see how to use the Prisma Cloud console to triage and take action.

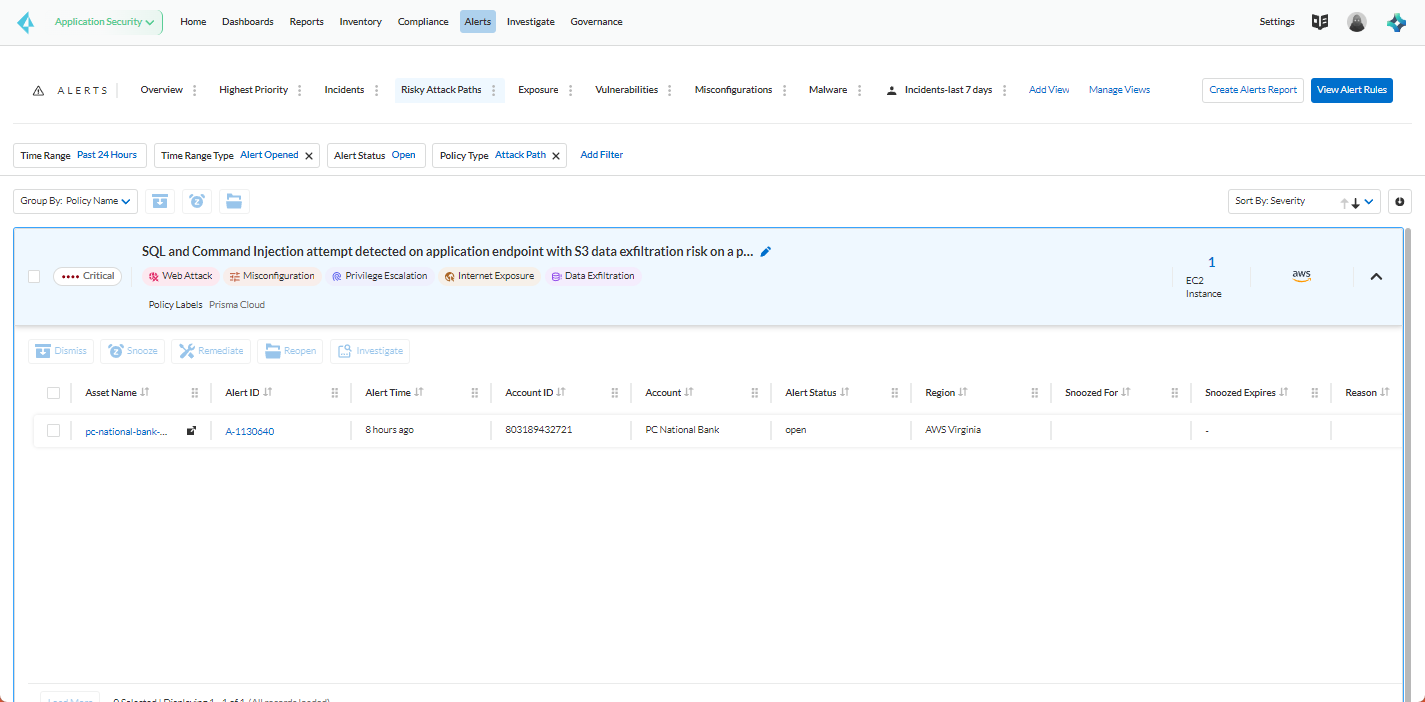
   1. Select the **Riskiest Attack Paths** view.
   2. Select a policy for which you want to review the alerts.

      In this example, the policy is of critical severity and it identifies a possible attempt at command injection and SQL injection on an application endpoint. The different findings associated with this policy are displayed for you to scan. By default the filter is preset to show you the open alerts within the last 24 hours. If you want to change the time range, or any other filters, make the changes and save it as a new view.

      <figure><img src="/files/9WmMdGYABXFY5A4EusuR" alt="alerts triage 1"><figcaption></figcaption></figure>
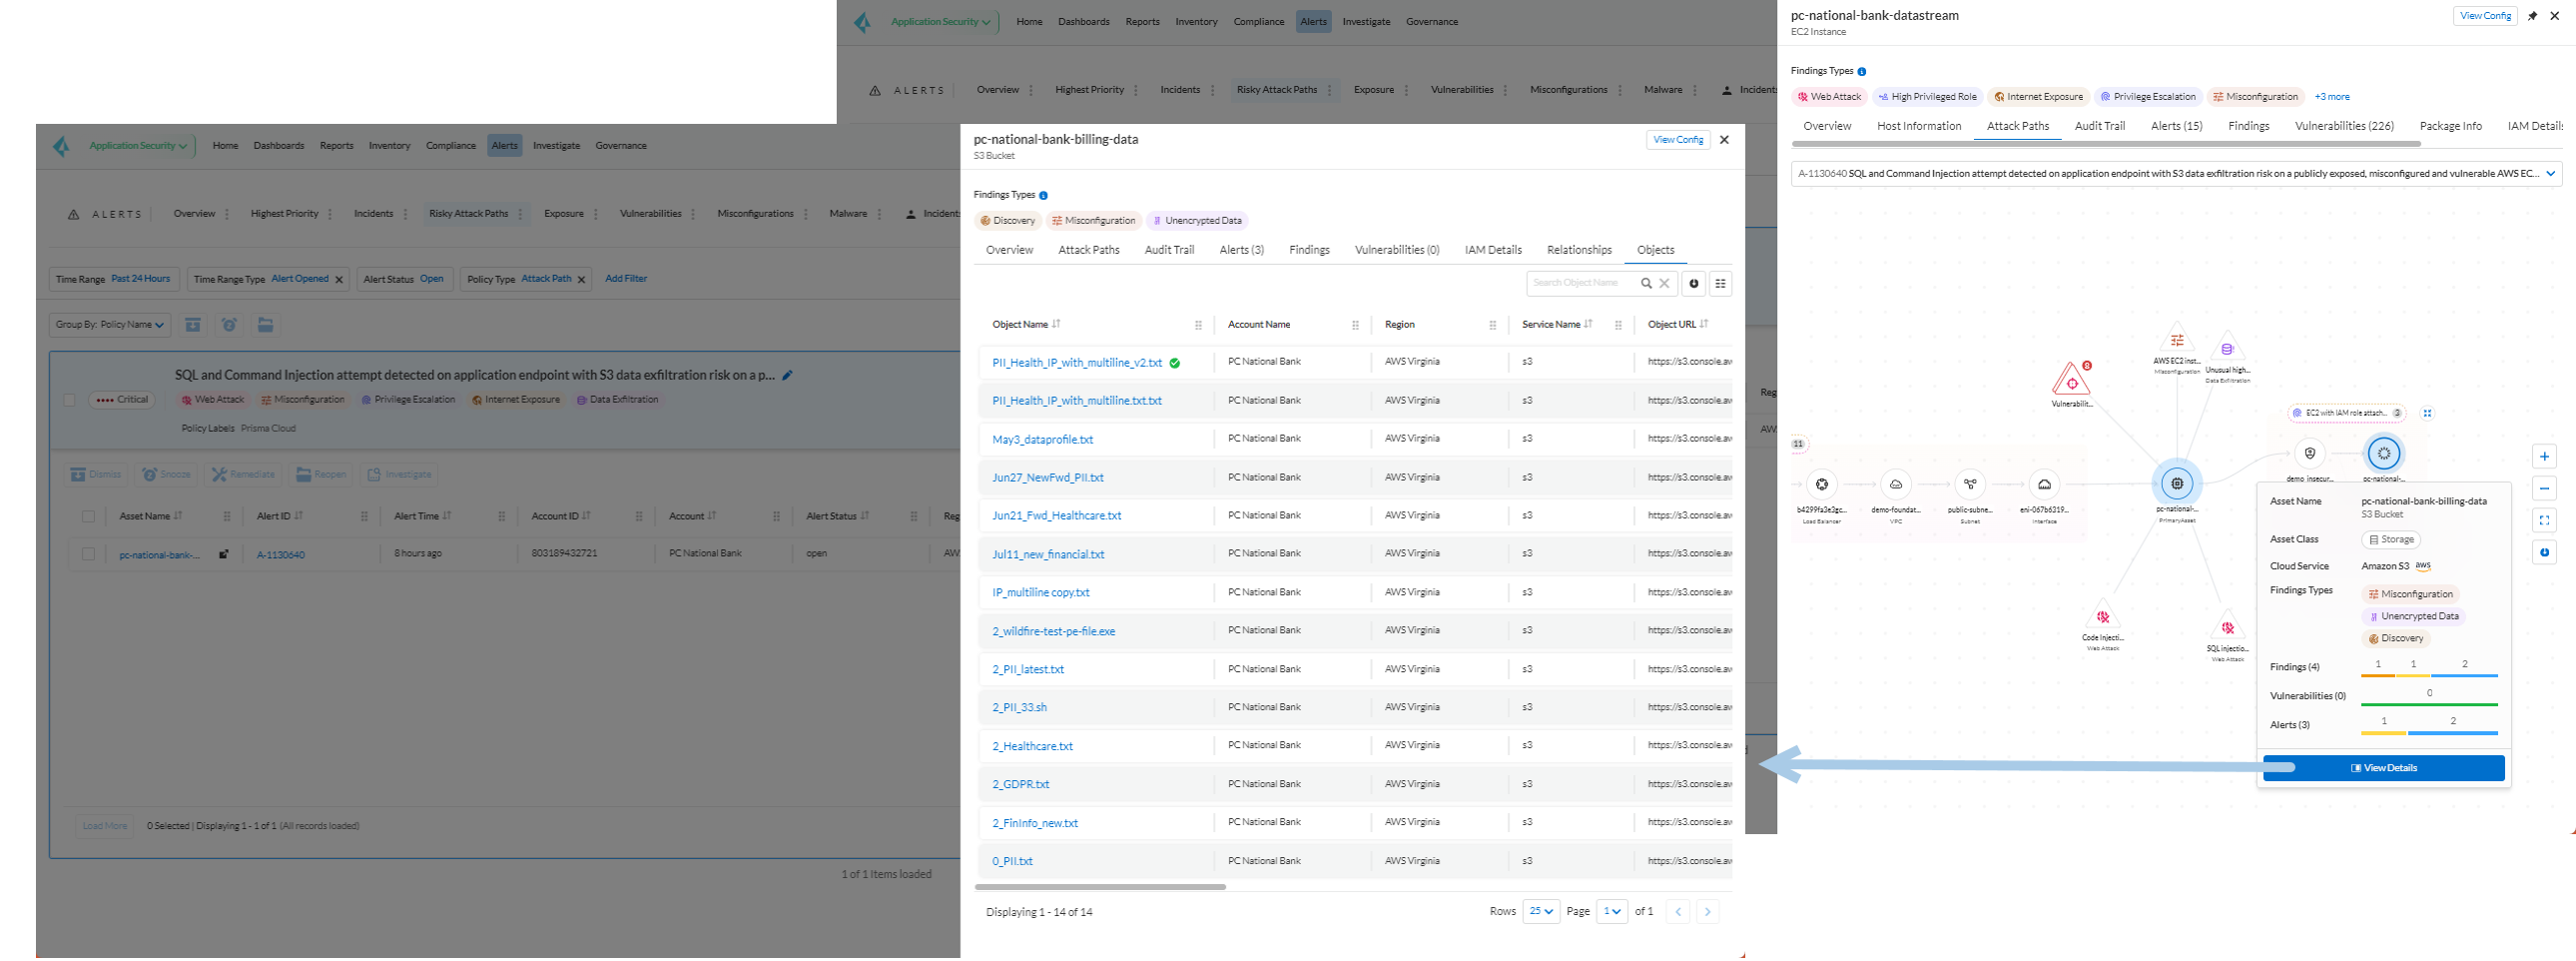
   3. Select the **Asset Name** link to view the evidence.

      The Attack path graph displays that the EC2 role is attached to a specific S3 bucket. Begin by reviewing all the findings with the S3 bucket and “Storage asset has sensitive data” finding. The object level information enables you to view the sensitive objects in the storage bucket.

      <figure><img src="/files/E8lmK6lxZDtKjyKn9kDt" alt="alerts triage 2"><figcaption></figcaption></figure>
   4. Get more context on issue.

      Select the asset, which is the EC2 instance to see who owns it, where it is hosted and more details on the application. This information is part of the **Overview** in the asset side panel.

      If you want to investigate further, use the **Investigate** link for the automatically generated search query that enables you to review the details for the alert on **Investigate**.
   5. Fix the problem.
      * Select **Send To > Jira** to file a ticket for the application team, if you do not have the authority to fix the issue.
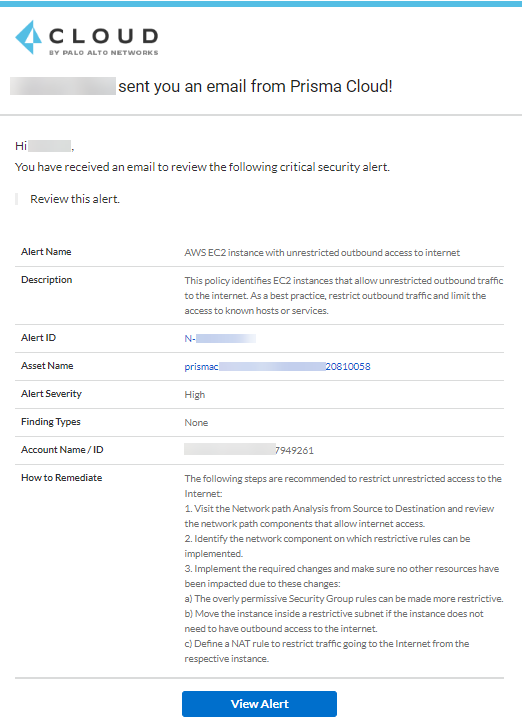
      * Select **Send To > Email** to enter the email address of the person or addresses (comma-separated list) of the team to whom you want to send the alert notification, add a message (optional), and **Send**. The recipient will receive an email with the alert details and remediation steps to resolve the alert (if applicable).

        <figure><img src="/files/qrlHbenwhrPjrT4SoZAO" alt="send to email"><figcaption></figcaption></figure>
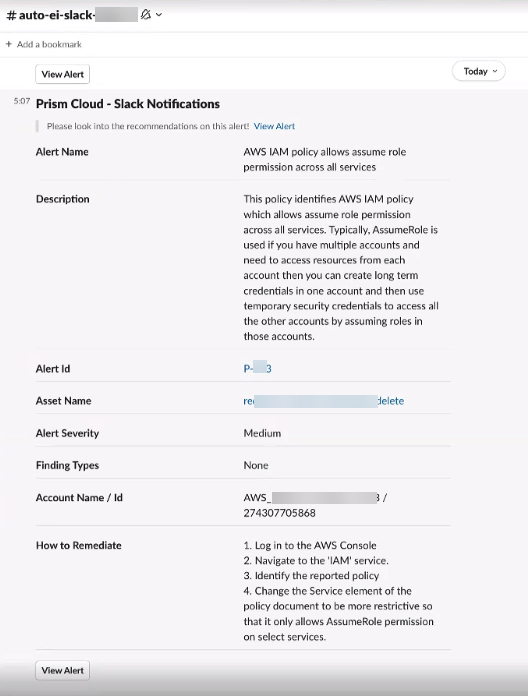
      * Select **Send To > Slack** to enter or select the Slack channel where you want to send the alert notification, add a message (optional), and **Send**. The specified channel will receive the alert details and remediation steps to resolve the alert (if applicable).

        <figure><img src="/files/EJqr0OuJAOdax8NNh7wX" alt="send to slack"><figcaption></figcaption></figure>
      * Use **Fix in Cloud** to prevent an incident from occurring in runtime. Prisma Cloud can automatically execute the CLI command provided in the policy recommendations to resolve the misconfiguration.
      * Use **Fix in Code** if you have access to the IaC resource and can submit a PR to the Version Control System.

        When the issue is addressed, the alert is moved to a Pending Resolution or Resolved state, and the risk is addressed.

        The process of submitting a PR to fix the issue directly in code is an offline process. When the process completes and the PR is submitted, the button will update to **View Details** and you can access the link to view the PR in your VCS.
2. **Auto-remediate alerts.**
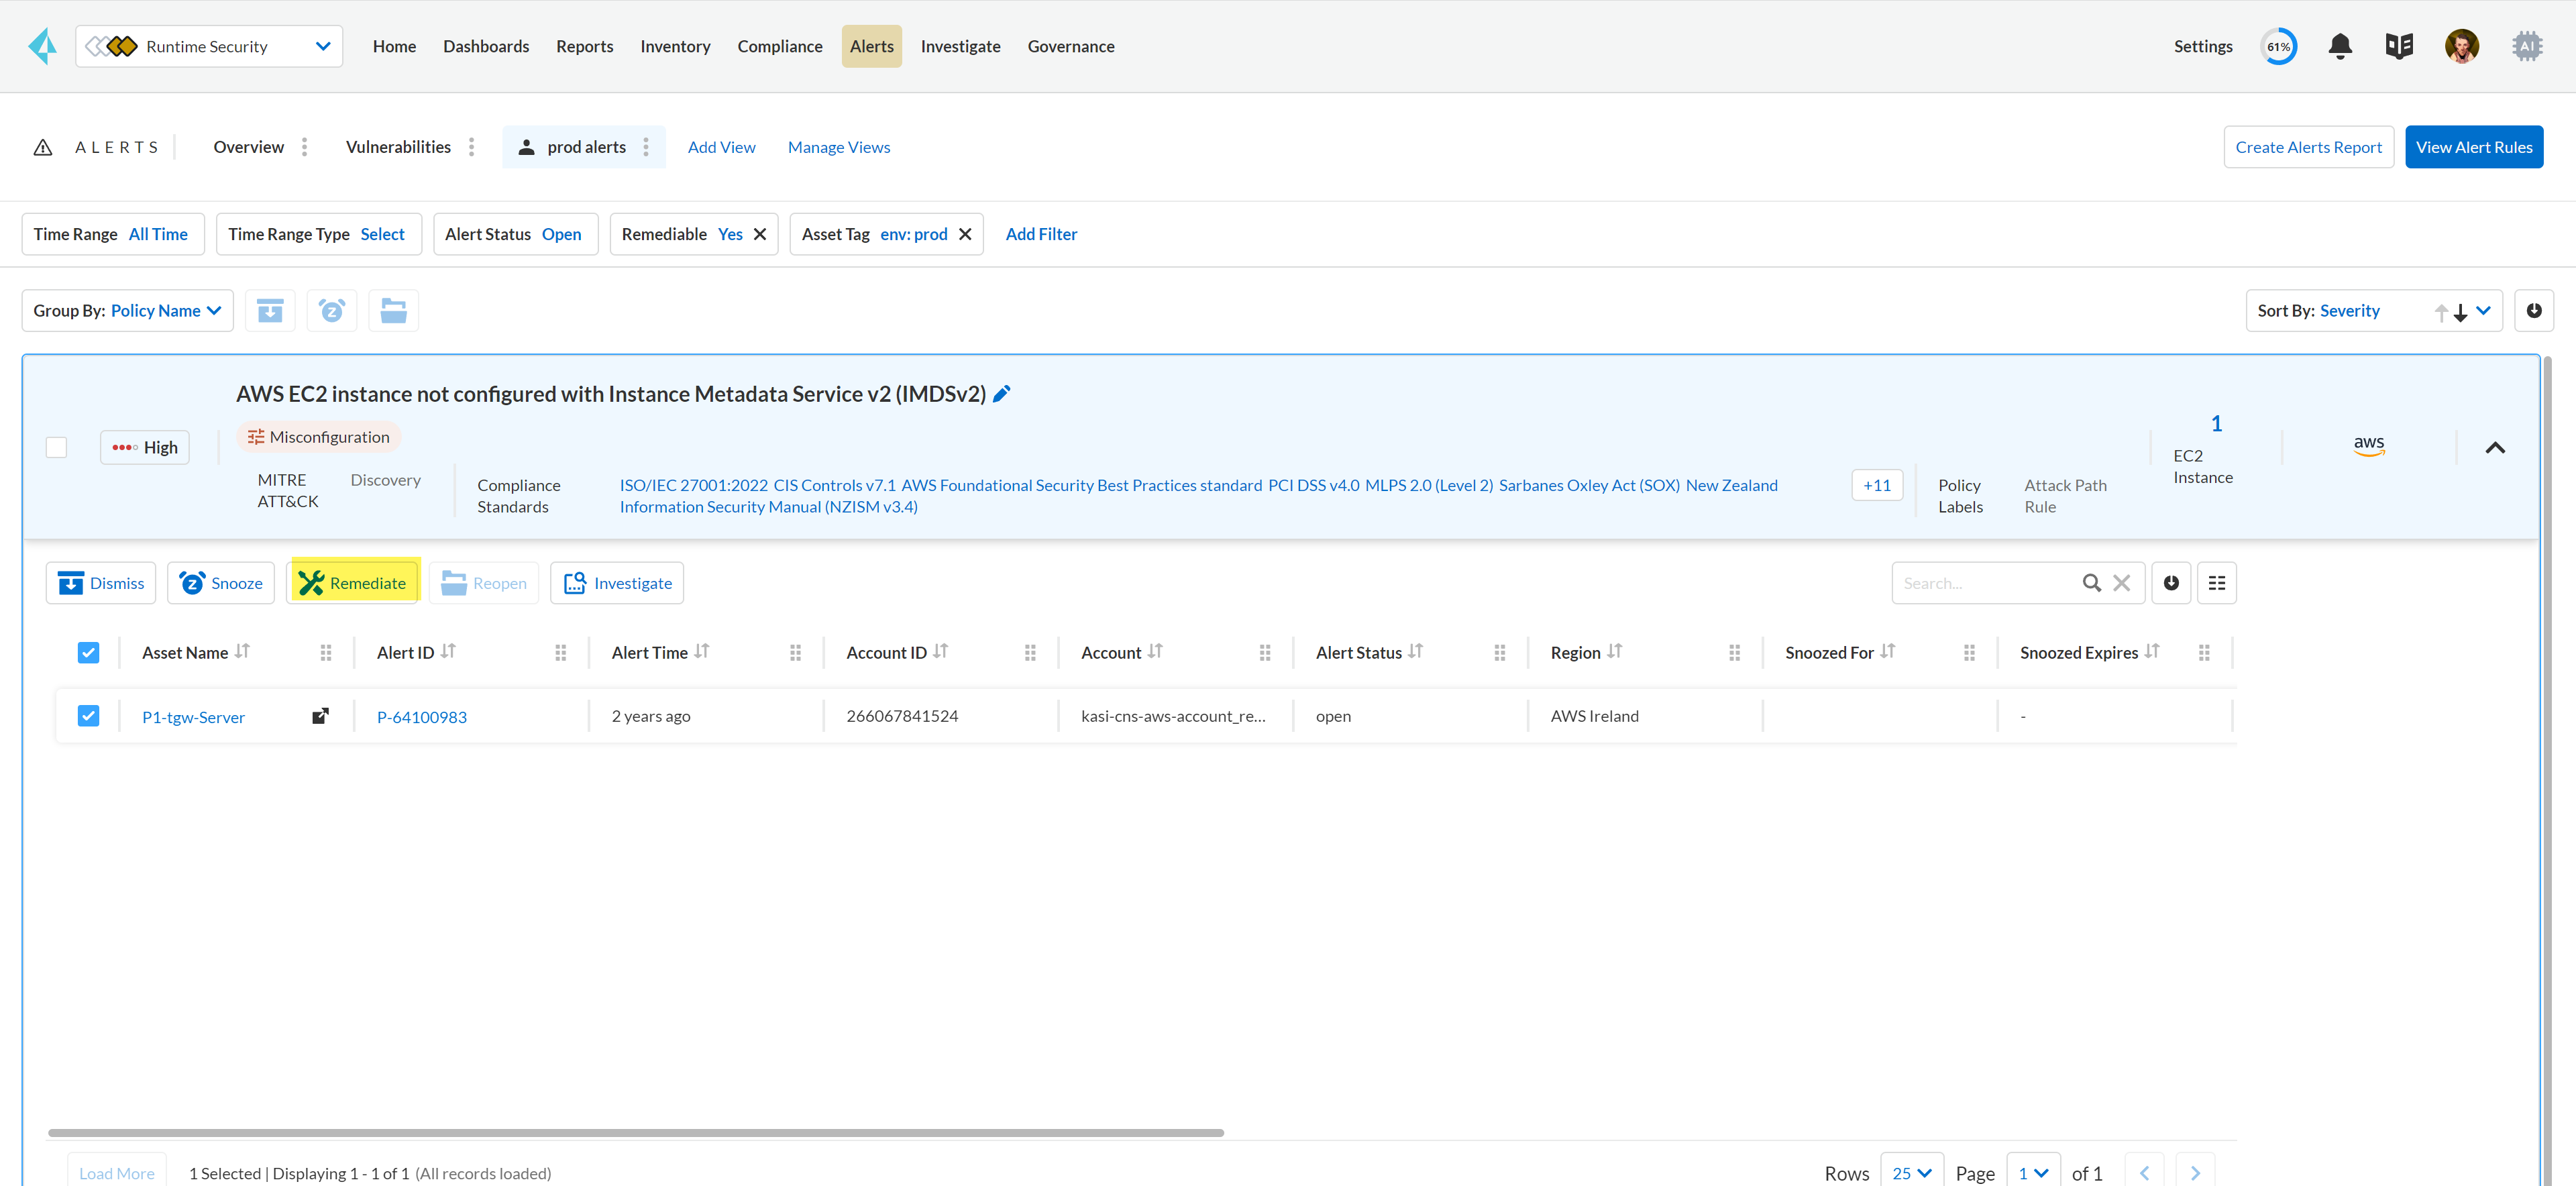
   1. Filter the alerts to show only **Alert State- Open** alerts that are **Remediable-Yes**.

      To find the alerts generated on your production environments, select the **Asset Tag** and enter the tags that you use to identify your assets on the CSP. In this example, the Asset Tag is `env: prod`

      <figure><img src="/files/9nvUeWgAyD7FbMoQuYI9" alt="alerts remediate prod tag"><figcaption></figcaption></figure>
   2. Select the policy for which you want to remediate alerts and expand to view the list of alerts.

      To review the recommendations for addressing the policy rule violation, click the pencil icon next to the policy name.
   3. Select the alert you want Prisma Cloud to resolve and **Remediate**.

      Because the action to remediate requires you to assess each alert individually and ensure that it is the appropriate action, you cannot enable automatic remediation for multiple alerts as a bulk action.

      To remediate issues, Prisma Cloud requires limited read-write access to your cloud accounts. With the correct permissions, Prisma Cloud can automatically run the CLI command required to remediate the policy violation directly on your cloud platform. You can review the required privileges in the CLI Command Description to identify the permissions Prisma Cloud requires in the associated cloud environments to be able to remediate the issue.

      When you fix the issue on the Cloud Service Provider such as AWS or GCP, the issue is resolved automatically and the resolution reason is displayed on Prisma Cloud. For a list of different reasons, see [Prisma Cloud Alert Resolution Reasons](https://github.com/PaloAltoNetworks/pc-docs-md/tree/main/enterprise-edition/content-collections/alerts/prisma-cloud-alert-resolution-reasons.md#id97d61277-e387-43b1-8a54-ec644bc02fdc).

      <figure><img src="/files/KUY2vU5sBqXkrOv2k0L8" alt="alerts remediate"><figcaption></figcaption></figure>
   4. Select **Execute Command** and **Confirm** to acknowledge the impact of automated remediation on your application.
3. **Find alerts that are opened or have an updated status within a given time range.**

   In conjunction with the Time Range, the Time Range Type filter gives you the ability to view alerts for:

   * Alert Opened—Filter on alerts based on when they were opened.
   * Alert Status Updated—Filter on alerts based on when the alert status got changed.
   * Alert Updated—Filter on alerts based on when the alert got updated due to resource updates or user triggered actions.
4. **Interpret alerts that display as N/A.**

   The Alert Rule name associated with an alert displays as N/A in the Alerts for Policy View. This N/A state means the match criteria changed because:

   * The alert rule that triggered the alert is disabled or deleted.
   * The cloud account is no longer included in the alert rule that triggered the alert.
   * The policy that triggered the alert is removed from the alert rule.
5. **Pivot from an alert into the cloud resource that triggered the alert to manually resolve the issue.**

   Prisma Cloud allows you to pivot directly from an alert to view the violating cloud resource and resolve the issue manually.

   1. Filter the alert list to show alerts with Alert Status **Open** and select the Policy Type. For example, **Network** or **Config**.
   2. Select the policy for which you want to resolve alerts.
   3. Select **Resource** () to pivot to the cloud resource containing the violation you want to resolve and follow the recommended steps.

      When you click **Resource**, Prisma Cloud redirects the request to the cloud platform. To view the resource details in the cloud platform, you must be logged in to the same account on the cloud platform where you want to further investigate.
6. **View the build-time details in an alert.**

   To shift left and fix issues earlier in the development lifecycle, you need a way to easily identify misconfigurations caused by drift between your code (IaC) resource and deployed resource. The Traceability information helps you connect an alert from the production environment back to the origin templates in your upstream development environment. If you want the alert details to include information to trace and attribute which build-time resource has caused a policy violation for a runtime resource deployed in your cloud account, complete the following steps.

   1. Enable a **Configuration** policy with the subtype Run, Build and attach it to an alert rule on Prisma Cloud.
   2. Onboard your IaC templates through a VCS integration.
   3. Make sure the Terraform resources include the **yor\_trace** [tag](/content-collections/application-security/risk-management/monitor-and-manage-code-build/traceability-and-tagging.md) so that your IaC resources are tagged with a unique UUID for tracing the relationship between the code resource and the runtime resource that is deployed from it. This is not necessary for CloudFormation.

## Work with Alerts Views

Create customized views to prioritize alerts.

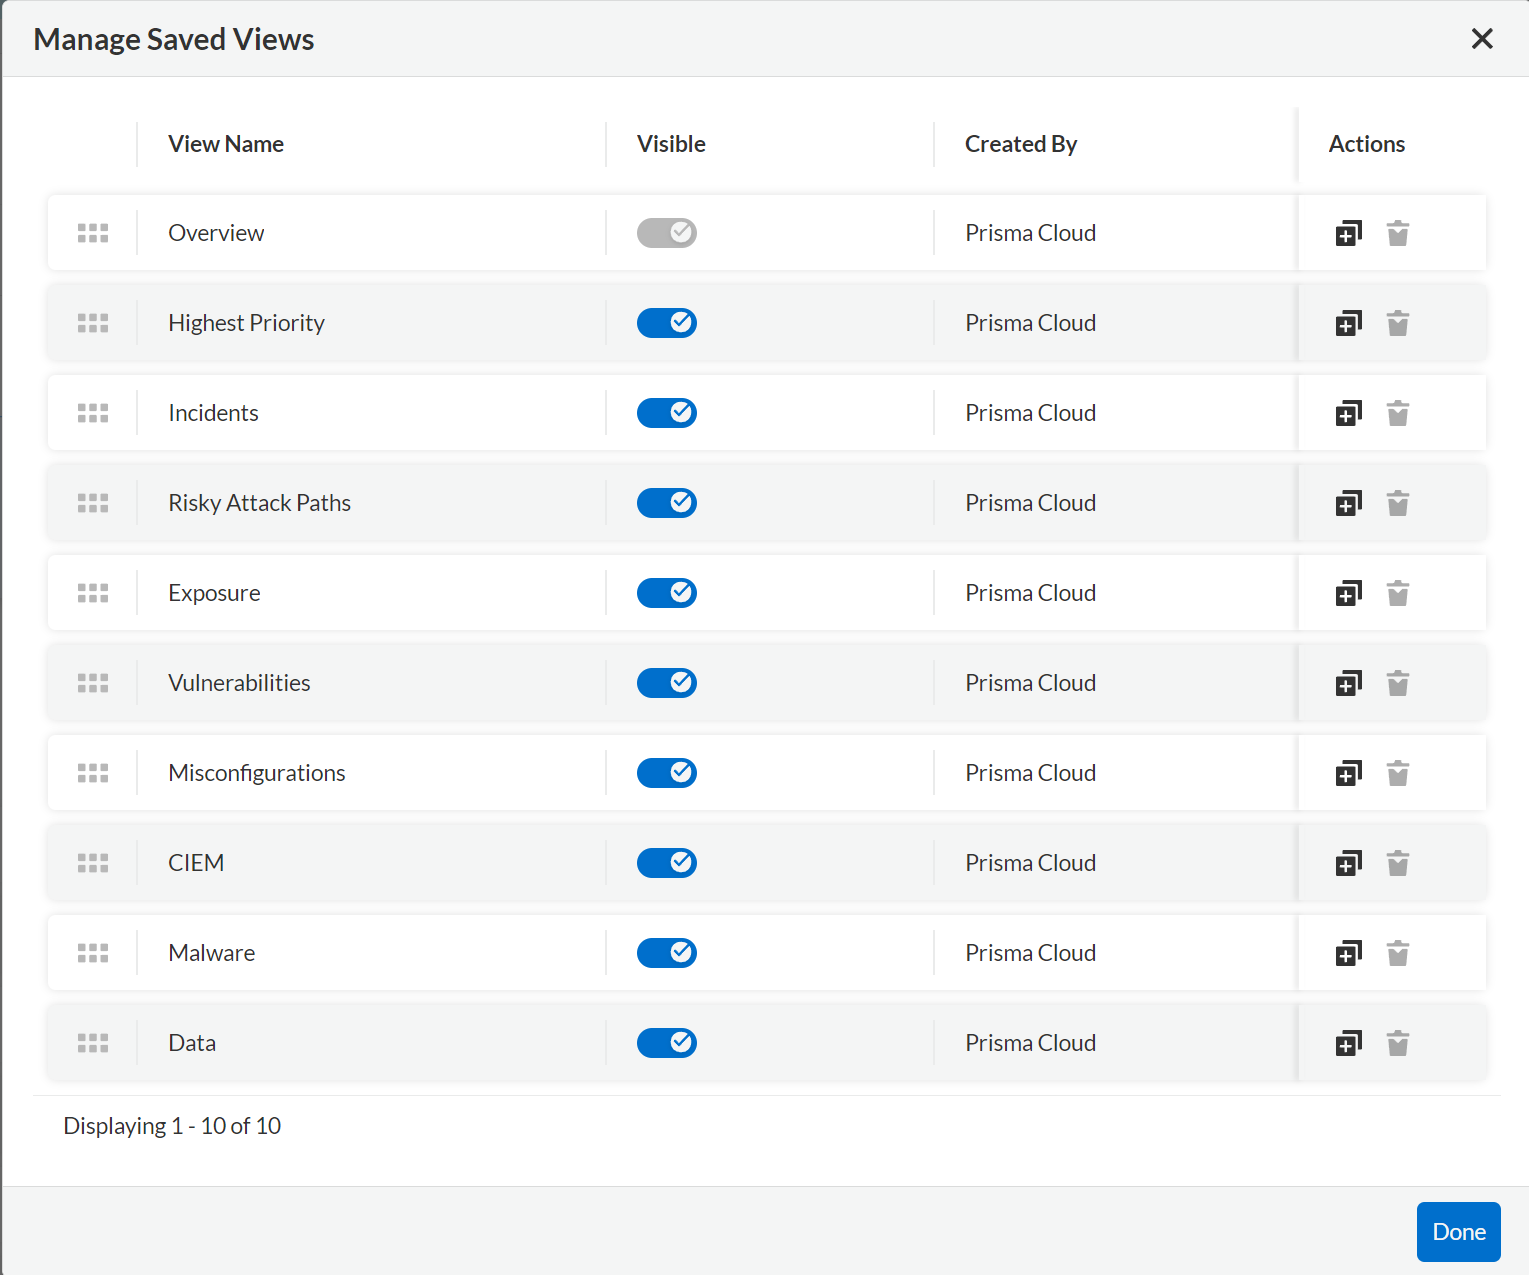
Create **Saved Views** to organize your alerts into appropriate threat vector categories. Prisma Cloud provides a set of default views—Overview, Highest Priority, Incidents, Risky Attack Paths, Exposure, Vulnerabilities, Misconfigurations, CIEM, Malware, and Data.

1. **Add View**.
   1. Select **Alerts** to see the default views. Each view includes preset filters that display the most relevant alerts for the category.

      Because the default (**System**) views are an opinionated suggestion of the filters that provide the results for a specific problem, if you make changes to a **System** view, you will either need to save it as a custom view with a new name or clear your edits.
   2. Select **Add View** to clone the view that you’re currently on and then make changes. You can create a maximum of 20 views.
2. **Manage Views**.
   1. Select **Manage Views** to reorder, hide/show, duplicate, and delete your saved views.

      You cannot delete or rename the **System** views.
   2. Select **Done** and **Confirm** to view your changes. The **Confirm** option displays only when you want to delete a view.

      <figure><img src="/files/tv73H8v1W7VrPf5yDsqg" alt="alerts views 4"><figcaption></figcaption></figure>

## Difference in Alerts Generated from a Policy versus Saved Search Query

Prisma Cloud enables you to run a query on the **Investigate** page, and save the query as a **Saved Search** so that you can re-run the same search periodically. If you then use this saved search query as match criteria in a policy, the matched issues that trigger alerts can be different from the corresponding results for the same query on the Investigate page.

The reason for this difference in results is that the policy engine functions slightly differently from the Investigate page. To understand the differences you need to know the following:

**Criteria for creating a policy using a saved search**

* Saved search must be valid to create a policy. For Config queries `config from cloud.resource where`, you may see the error **RQL invalid for policy creation**. This error indicates that the saved search RQL is not valid to create a policy.
* To create a policy, the saved search must meet these guidelines:
  * Does not include the `azure.resource.group` attribute
  * When a `tag` attribute is within the json.rule, it does not include a resource list (reference with `{` `}`)
  * Includes either the `api.name` attribute or the `finding.type` attribute
    * When it includes the `api.name` attribute, it includes a `json.rule` or the `group by` or `count` function
    * When it includes the `finding.type` attribute, the specified values for the attribute do not contain `Prisma Cloud Alert`

      You can however, include the `Not Equal Prisma Cloud Alert` or `Not IN (Prisma Cloud Alert, boo, etc.)` operator.

**Criteria for updating a saved search used in a policy**

If you use a saved search to create a policy, you cannot update the following:

* `cloud.type`
* `api.name`
  * For non-join queries, `api.name` cannot be changed
  * For join queries, the `api.name` in the clause used for `Show` cannot be changed.

    Example query structure: `X; Y; Z; filter…; Show Y`

    `api.name` in Y **cannot** be updated (because X is used for Show)

    `api.name` in X, Z **can** be updated

**Criteria for what is ignored or replaced when displaying results**

The values for the following attributes in a saved search are replaced by the scope you define in an alert rule:

* `cloud.account` or `cloud.accountgroup`
* `cloud.region`
* `tag` (tag filter used within the `json.rule` will be ignored)
* `cloud.type` , `cloud.service`
* When `resource.status` is not specified in the query, both the Investigate page and the policy engine will return active **and** deleted resources.

However, the deleted resources for the policy engine include only the *resources deleted since the last scan* within the search scope, while the Investigate page scans all deleted resources available in the database. Specifically:

| **Resource Status** | **Policy Engine**                                           | **Investigate**                                                                                                                                          |
| ------------------- | ----------------------------------------------------------- | -------------------------------------------------------------------------------------------------------------------------------------------------------- |
| Active              | Resources that are running at the time of scan only         | Only resources that were running at the end time of the interval (creation time before time interval ends and deletion, if any, after the time interval) |
| Deleted             | Resources deleted since the last scan only                  | Only resources that were deleted during the specified time interval (deletion time within the interval)                                                  |
| Not Specified       | Running resources and resources deleted since the last scan | Any resources that existed during the specified time interval                                                                                            |

**JOIN queries**

* For Investigate queries, cross-account join will be applied by default.
* For policy engine, all queries are run on a specific account, which means JOIN will be done only within one account at a time.


---

# Agent Instructions
This documentation is published with GitBook. GitBook is the documentation platform designed so that both humans and AI agents can read, navigate, and reason over technical content effectively. Learn more at gitbook.com.

## Querying This Documentation
If you need additional information that is not directly available in this page, you can query the documentation dynamically by asking a question.

Perform an HTTP GET request on the current page URL with the `ask` query parameter, and the optional `goal` query parameter:

```
GET https://docs.prismacloud.io/content-collections/alerts/view-respond-to-prisma-cloud-alerts.md?ask=<question>&goal=<endgoal>
```

`ask` is the immediate question: it should be specific, self-contained, and written in natural language.
`goal` is optional and describes the broader end goal you are ultimately trying to accomplish on behalf of the user. GitBook uses it to tailor the answer towards what is most useful for that goal.

The response will contain a direct answer to the question and relevant excerpts and sources from the documentation.

Use this mechanism when the answer is not explicitly present in the current page, you need clarification or additional context, or you want to retrieve related documentation sections.