> For the complete documentation index, see [llms.txt](https://docs.prismacloud.io/llms.txt). Markdown versions of documentation pages are available by appending `.md` to page URLs; this page is available as [Markdown](https://docs.prismacloud.io/content-collections/application-security/ides/connect-jetbrains.md).
# Jetbrains
Integrate the Prisma Cloud Code Security plugin (plugin) for JetBrains IDEs (IDE) to seamlessly enhance security while coding, allowing you to identify issues before you commit your code, reducing the risk of pull requests failing due to undetected issues. Prisma Cloud scans for security policy violations based on both default, out-of-the-box and custom policies.
For default policies, refer to the [Policies](https://docs.prismacloud.io/en/enterprise-edition/policy-reference/get-started-code-sec-policies/get-started-code-sec-policies) documentation.
For information on creating custom policies, refer to [Custom Build Policies](https://github.com/PaloAltoNetworks/pc-docs-md/tree/main/enterprise-edition/content-collections/governance/custom-build-policies/custom-build-policies.md).
The plugin utilizes Prisma Cloud’s capabilities to scan these security categories:
* IaC misconfigurations in IaC templates such as Kubernetes and Terraform. For a list of supported IaC frameworks see [Supported Technologies](/content-collections/application-security/supported-technologies.md)
* SCA vulnerabilities: Includes security issues in both direct and transitive open-source dependencies
* Secrets: Security vulnerabilities in your base images
* Licenses: Software license noncompliance
You can prioritize findings and address the most critical issues by filtering the scan results based on severity.
The Prisma Cloud Code Security plugin supports all JetBrains products.
## Prerequisites
1. Permissions.
1. To integrate the plugin, **Developer**, **AppSec Admin** or **System Administrator** roles are required.
2. For **GRBAC**, provide the following permissions in a [Permission Group](https://docs.prismacloud.io/en/enterprise-edition/content-collections/administration/create-custom-permission-groups).
* *Policies*: **Policies** - 'View' permissions
* *Application Security*: **Projects** - 'View' permissions
* *Settings*: **Providers** - ('View' and 'Create') OR ('View' and 'Update') permissions
For information about roles and permissions on Prisma Cloud, refer to [Prisma Cloud Administrator Permissions](/content-collections/administration/prisma-cloud-admin-permissions.md).
2. Install [Python](https://www.python.org/downloads/) v3.7 or above, [Pipenv](https://docs.pipenv.org/), or a running [Docker](https://www.docker.com/products/docker-desktop) daemon.
The plugin automatically invokes the latest version of Prisma Cloud Code Security.
3. On Prisma Cloud.
* Add the Prisma Cloud IP addresses and hostname for Application Security to an [allow list](/content-collections/get-started/console-prerequisites.md) to enable access to the Prisma Cloud console
* [Generate and copy the Prisma Cloud access key](/content-collections/administration/create-access-keys.md) to enable access to Prisma Cloud. The access key includes a key ID and secret
* Retrieve your Prisma Cloud API URL, which varies depending on the region and cluster on which your tenant is deployed
For Prisma Cloud API URL, replace **app** in the URL with **api**.
## Installation
You can install the plugin directly through your IDE or the JetBrains Marketplace.
After completing the installation, restart your IDE if prompted.
### Install through JetBrains IDE
1. In your IDE, select **Settings** > open the **Plugins** panel > search for **Prisma Cloud** > **Install**.
### Install from the JetBrains Marketplace Website
1. **Option #1**: Access the [Prisma Cloud extension](https://plugins.jetbrains.com/) directly on the JetBrains Marketplace.
**Option #2**: Access the Marketplace from the Prisma Cloud console:
In **Application Security**, select **Settings** > **Connect Provider** > **Code & Build Providers** > **JetBrains** (under IDEs).
2. Select a platform > search for the **Prisma Cloud** plugin > Select **Get**.
3. Select **Download** from the **Versions** tab > and then **Got it** in the popup.
## Configure Plugin Settings
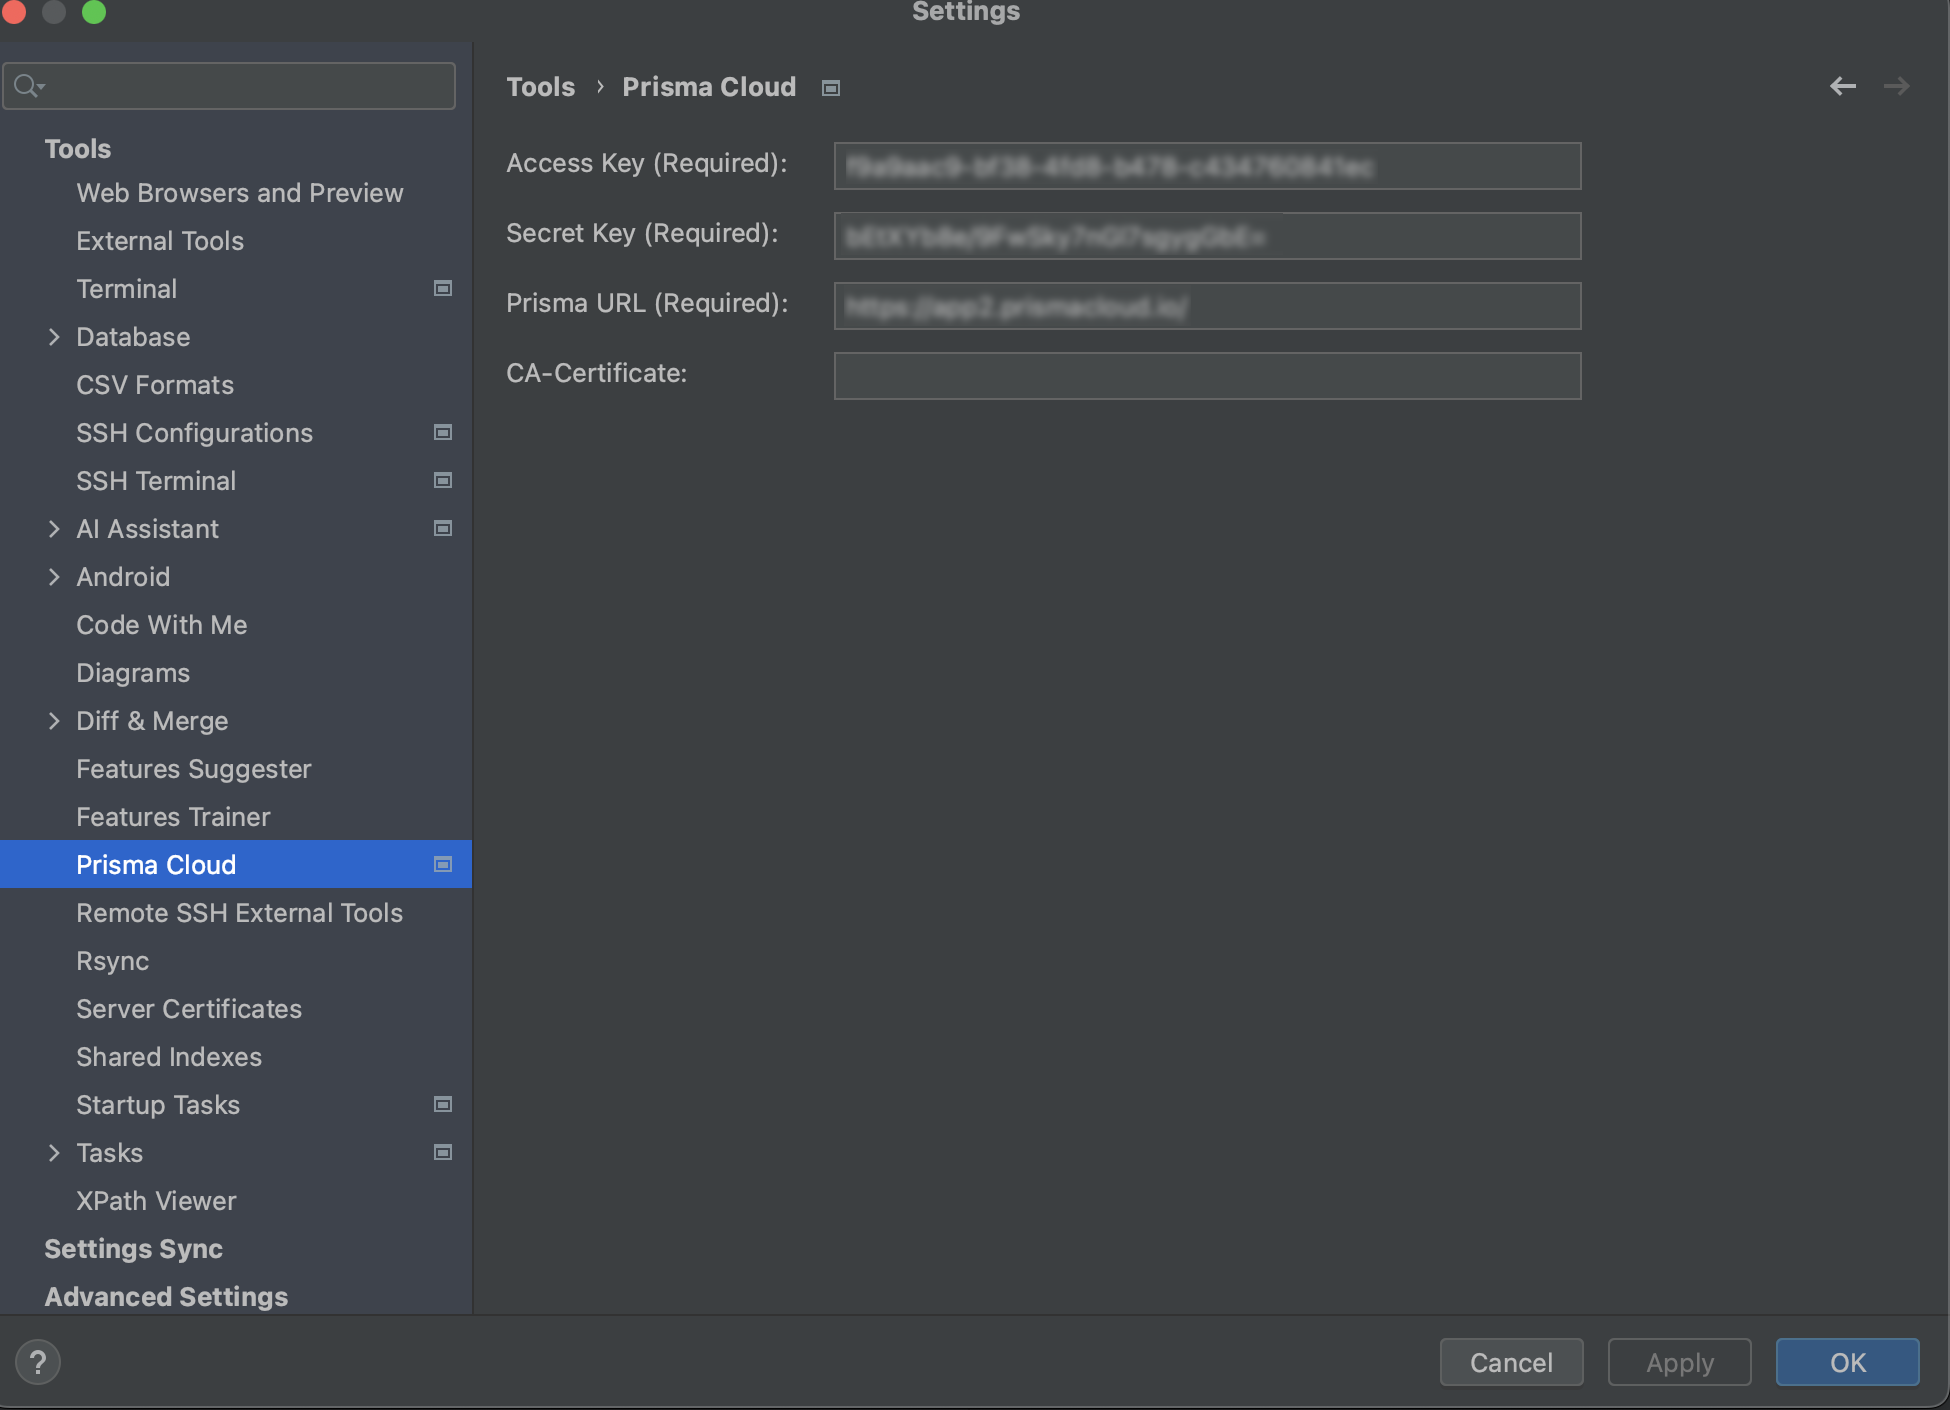
1. In your IDE, select **Settings** > **Tools** > **Prisma Cloud**.
2. Fill in the provided fields:
* **Access Key** (required): The Prisma Cloud access key ID generated as part of the **Prisma Cloud prerequisites** above
* **Secret Key** (required): The Prisma Cloud secret key generated as part of the **Prisma Cloud prerequisites** above
* **Prisma URL** (required): Your Prisma URL - see **Prisma Cloud prerequisites** above
* **CA-Certificate** (optional): Add the CA certificate. Format: `.pem` file
3. Click **OK**.
## UI Layout
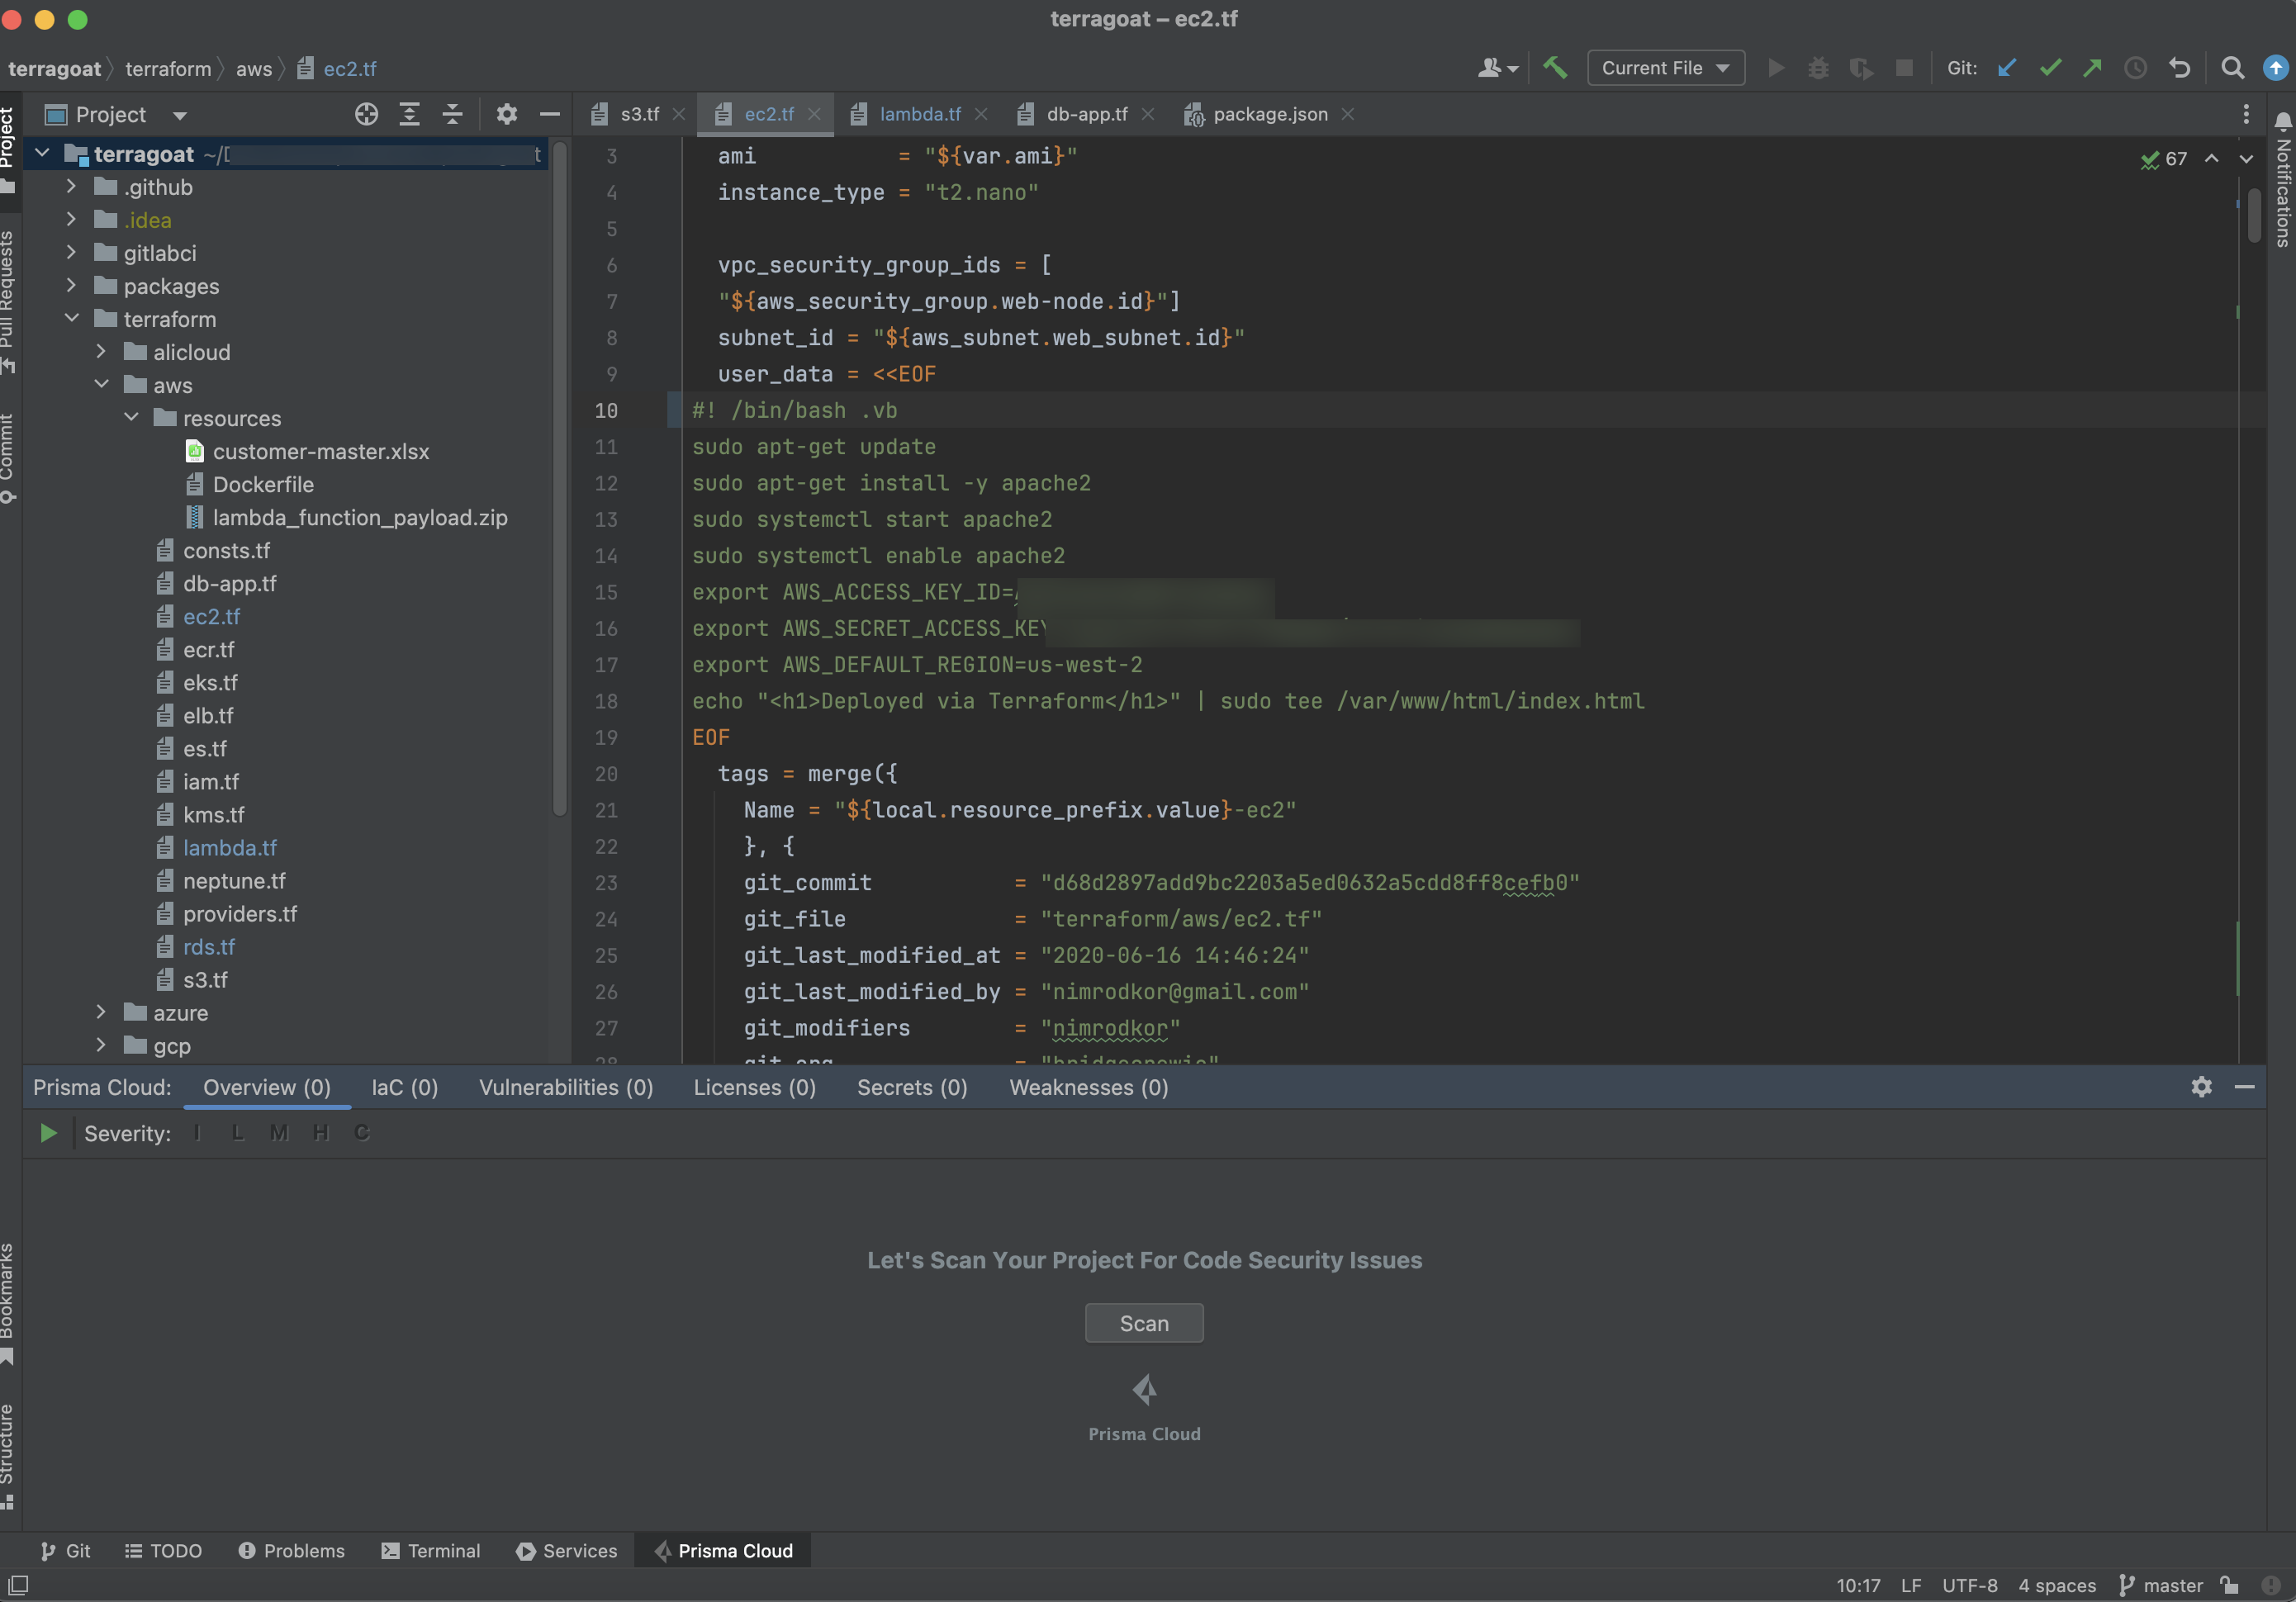
Select the Prisma Cloud tab at the bottom menu of the IDE to access the plugin. The UI includes the following sections:
* Left pane: The **Navigation** panel featuring a tree structure displaying the project folders
* Middle pane: The **Code editor**. Allows you to review your codebase, and view a list of findings related to a resource (for IaC misconfigurations) or file, along with remediation options
* Bottom pane: The **Problems Tool**. Enables you to perform scans and view detailed results. After scans are completed, the left pane of the Problems Tool displays a navigation tree listing folders containing files with detected issues under the **Overview** tab. You can also filter the displayed issues by security category (such as IaC misconfigurations) and severity, with values including 'C' (Critical), 'H' (high), 'M' (medium), 'L' (low) and 'I' (Informational). Selecting a file in the Problems Tool opens the issues detected within it in the right pane, where you can access detailed information, code differences (when available), and [Remediation](#remediation) options
## Usage
The Prisma Cloud Security extension allows you to conduct comprehensive scans, manage findings efficiently, and remediate issues, all within your coding environment.
## Scans
Code scans can be performed on an entire project or selected files.
* **Full scan**: Click either **Scan** or the **Play** button in the **Problems Tool** to initiate a scan of the entire project
* **File scan**: Open or save a specific file to trigger a scan exclusively for that file
### Cancel a Scan
You can cancel a scan by clicking the red **Cancel** button that replaces the **Play** button when starting a scan. After cancelling a scan, results from the previous scan remain.
## Findings
You can manage findings through either the **Code editor** or the **Problems Tool**.
### Manage Findings through the Code editor
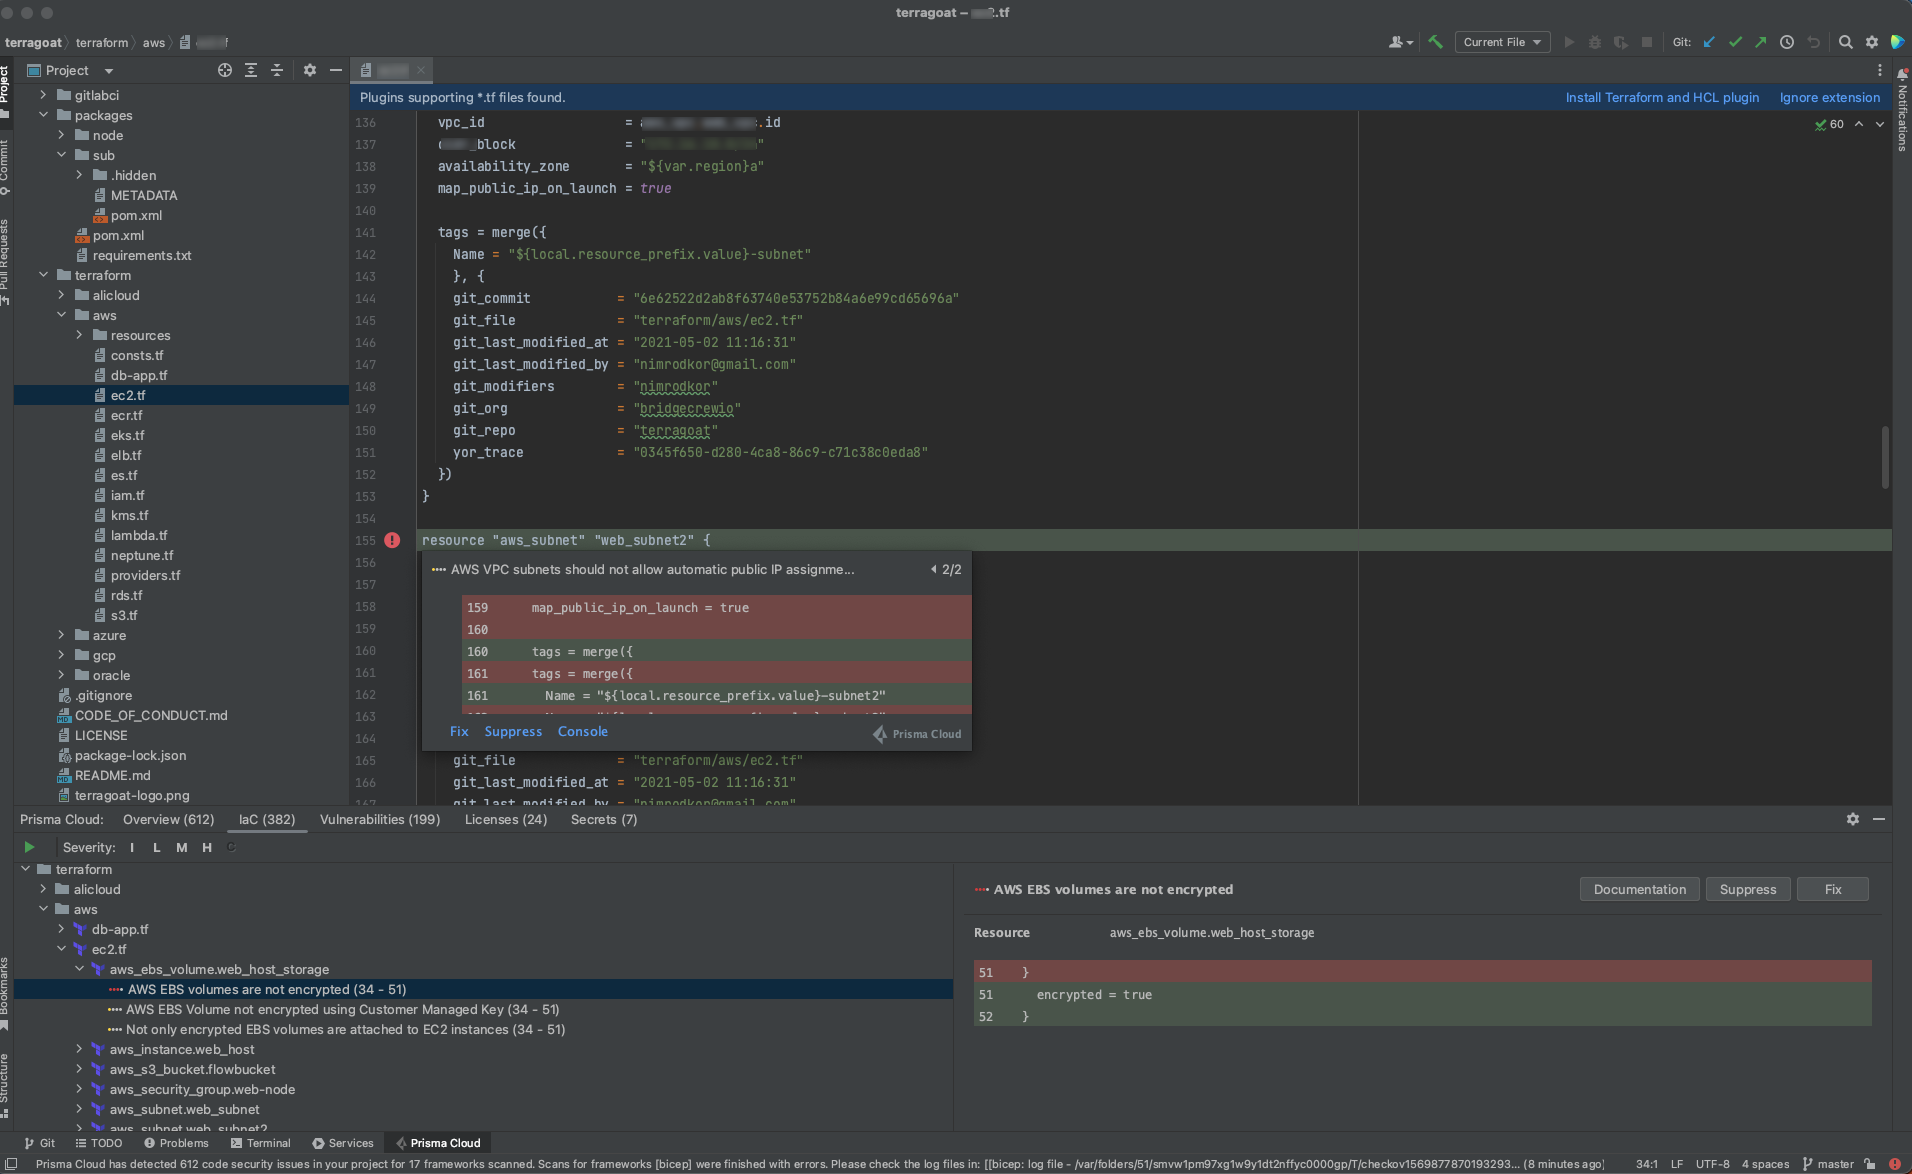
* **IaC** misconfigurations: The red marker indicating an error is displayed on the first line of a resource block. Select the marker to view the issue, including its name, severity, and affected lines of code. If applicable, line(s) of code displaying the fix are shown, illustrating the correction, or a code diff highlighting the changes between the error and the fix may be provided. If there are multiple issues in a resource, the total count of issues is displayed, and an arrow enables scrolling through them. In addition, remediation options are displayed. To display a detailed view of the issue in the Problems Tool, click **Console**
A resource block declares a resource of a given type with a given local name. The name is used to refer to this resource from elsewhere in the same Terraform module, but has no significance outside of the scope of a module.
* **SCA vulnerabilities**: A red mark next to a line number indicates vulnerabilities within a package on that line. Selecting the marker reveals detailed information about the first CVE vulnerability, including the CVE identifier, severity, vulnerable package and version, fixed version, and root package and version. Additionally, the total number of vulnerabilities in the package is displayed. Use the arrow to scroll through all vulnerabilities, with the current position and total count displayed. Remediation options are also displayed. To display a detailed view of the issue in the Problems Tool, click **Console**
* **Licenses**: A red mark next to a line number indicates license non-compliance within a package on that line, and the severity of the issue. Remediation options are displayed. To display a detailed view of the issue in the Problems Tool, click **Console**
* **Secrets**: A red mark next to a line number indicates a secret detected in the file, including the severity of the finding. Remediation options are displayed. To display a detailed view of the issue in the Problems Tool, click **Console**
### Manage Findings through the Problems Tool
The 'Problems Tool' displays expanded details of an issue, as well as remediation options. For more details on each type of finding see **Code editor** findings above.
Findings are organized by category. The **Overview** tab, which opens by default, displays all findings from all categories organized into folders. You can filter findings by selecting a specific category tab such as Iac, and by severity. Values: 'I' (informative), 'L' (Low), 'M' (Medium), 'H' (High), 'C' (Critical).
## Remediation
You can mitigate issues directly through both the **Code editor** or the **Problems Tool**. Options include **Fix**, **Suppress**, or **Documentation**.
Not all types of remediation are available for all issues.
### Fixes
When selecting an issue in either the Code editor or Problems Tool, you can apply automatic fixes, if available, by clicking **Fix**. The following list displays the type of fix available for the different categories of issues.
* **IaC misconfigurations**: The fix modifies the configuration. If an automatic fix is not available you can use the suggested fix to manually address the code issue
* **SCA vulnerabilities**: The fix bumps the package version. You can directly fix the specific CVE vulnerability that has been detected during the scan by upgrading the package to the version that includes a fix. You can fix all of the CVE vulnerabilities found in a package by selecting **Fix All** in the **Problems Tool**. This fix upgrades the package to a version that addresses all the issues
* **Secrets** issues: Follow the policy guidelines
* **License** mis-compliance: Follow the policy guidelines
### Suppression
Suppress an issue to temporarily hide or ignore an issue without fixing it, allowing you to concentrate on more important issues.
The suppression is scoped to the file.
1. Before you begin, enable **Developer Suppressions** on the Prisma Cloud console.
1. In **Application Security**, select **Settings** > **Application Security** under 'Configure' in the left navbar.
2. Scroll down to **Developer Suppressions** and toggle the switch button **ON**.
2. In the IDE, select an issue > **Suppress** from either the Code editor or Problems Tool.
3. Provide a justification for the suppression> **OK**.
The justification will be added as a commented annotation to your source code.
After suppressing an issue, the file is not scanned for two minutes. This is to prevent the issue from being re-triggered. Saving the file during the hold period will not trigger a scan.
For more information on Suppression, refer to the [Suppression](/content-collections/application-security/risk-management/monitor-and-manage-code-build/suppress-code-issues.md) documentation.
### Documentation
If automated fixes are not available, policy documentation can provide guidance on how to address the issue: Select an issue > **Documentation**. You are redirected to the relevant policy documentation which includes suggested guidelines on how to solve the issue.
---
# Agent Instructions
This documentation is published with GitBook. GitBook is the documentation platform designed so that both humans and AI agents can read, navigate, and reason over technical content effectively. Learn more at gitbook.com.
## Querying This Documentation
If you need additional information that is not directly available in this page, you can query the documentation dynamically by asking a question.
Perform an HTTP GET request on the current page URL with the `ask` query parameter, and the optional `goal` query parameter:
```
GET https://docs.prismacloud.io/content-collections/application-security/ides/connect-jetbrains.md?ask=&goal=
```
`ask` is the immediate question: it should be specific, self-contained, and written in natural language.
`goal` is optional and describes the broader end goal you are ultimately trying to accomplish on behalf of the user. GitBook uses it to tailor the answer towards what is most useful for that goal.
The response will contain a direct answer to the question and relevant excerpts and sources from the documentation.
Use this mechanism when the answer is not explicitly present in the current page, you need clarification or additional context, or you want to retrieve related documentation sections.