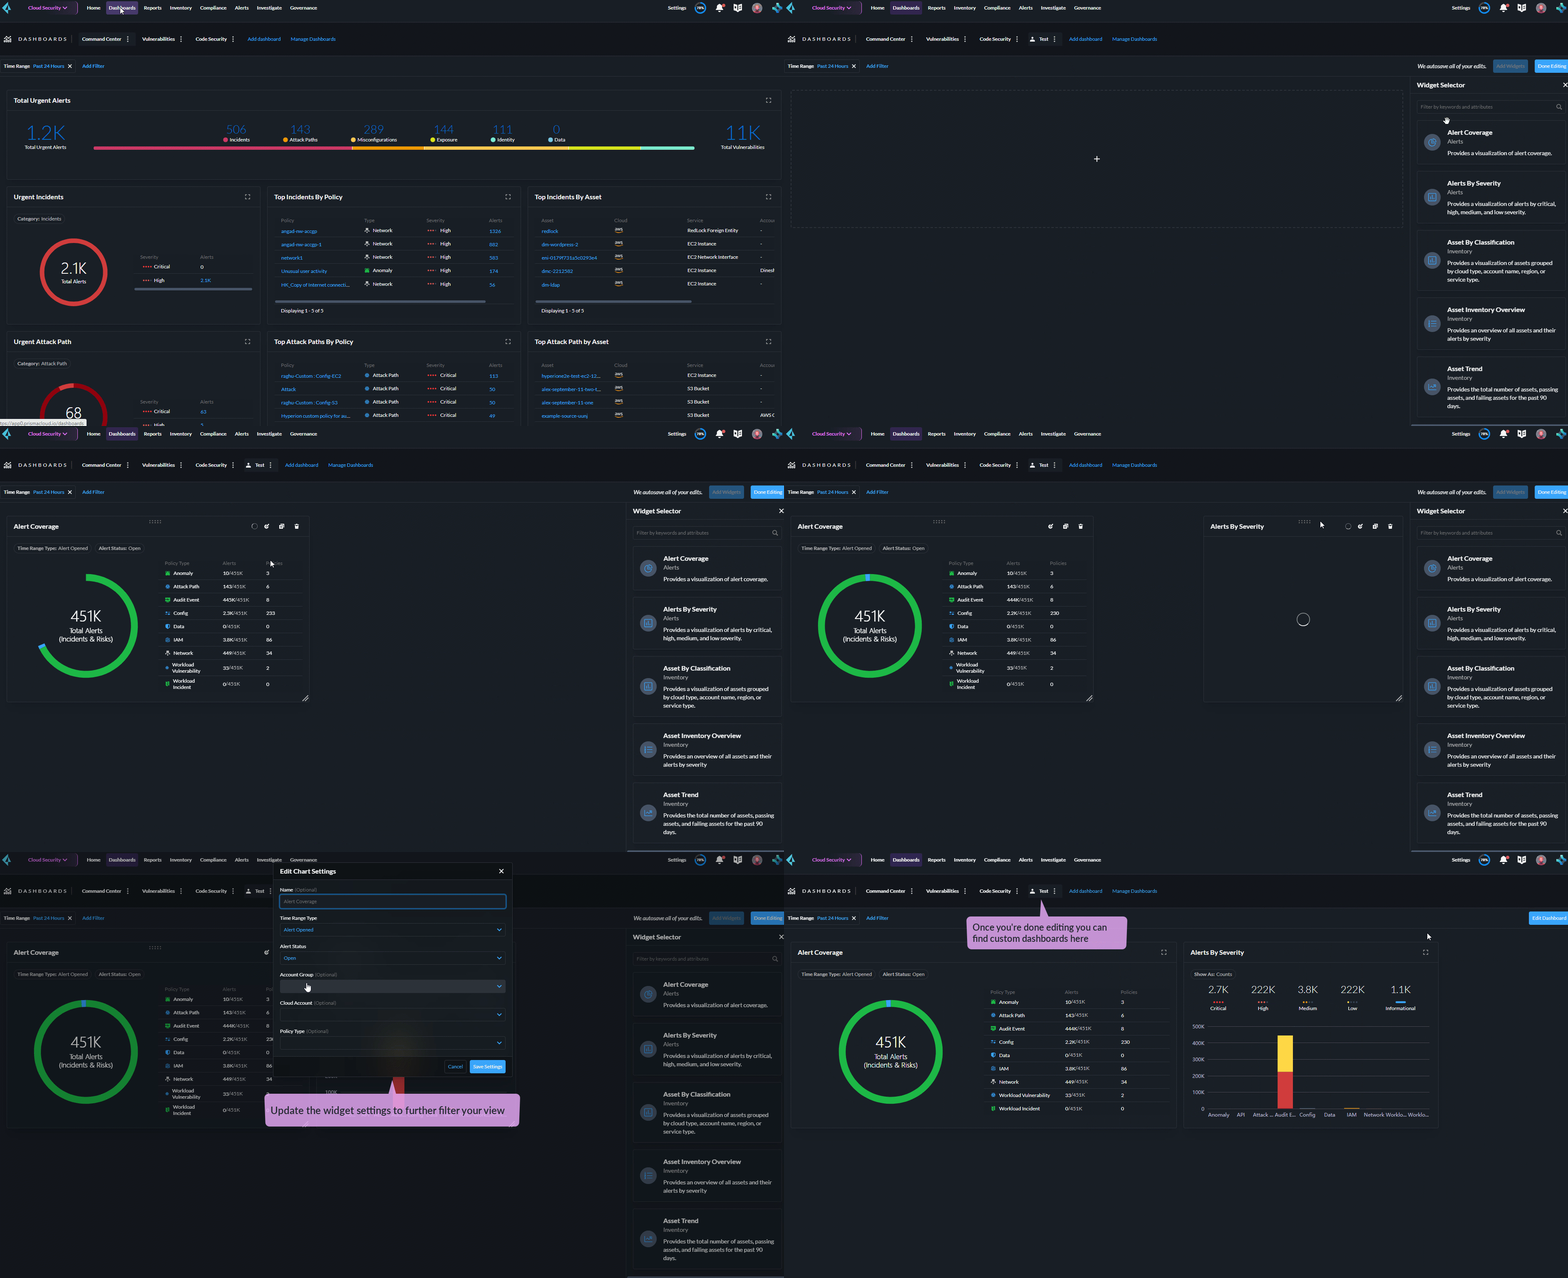
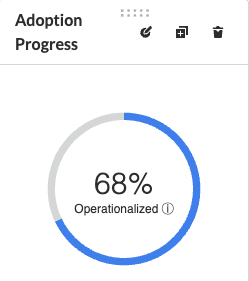
 |
| **Alert Coverage** | Provides a visualization of alerts coverage. |
|
| **Alert Coverage** | Provides a visualization of alerts coverage. | 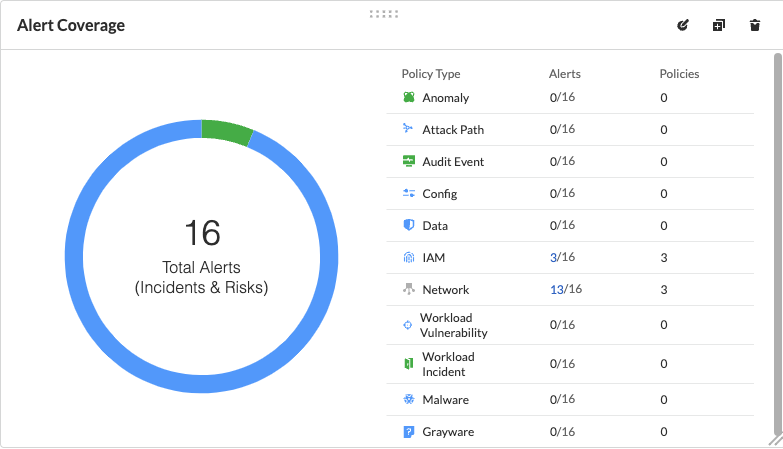 |
| **Alerts by MTTR** |
|
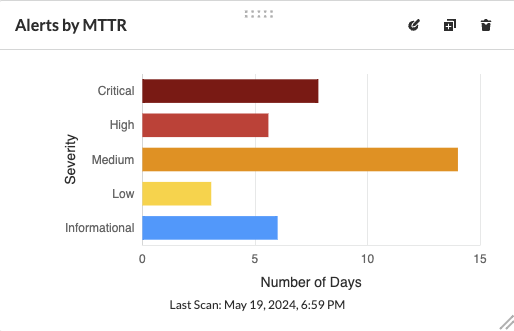
| **Alerts by MTTR** | Displays alerts by severity and their mean time to resolution.
(If an alert is opened and resolved more than once a day, the latest resolution time is used for the MTTR calculation. An individual alert may be counted multiple times, if the same alert is resolved many times over multiple days.)
| |
| **Alerts by Status** | Displays the total number of alerts by their current status — Resolved, Open, or Dismissed. |
|
| **Alerts by Status** | Displays the total number of alerts by their current status — Resolved, Open, or Dismissed. | 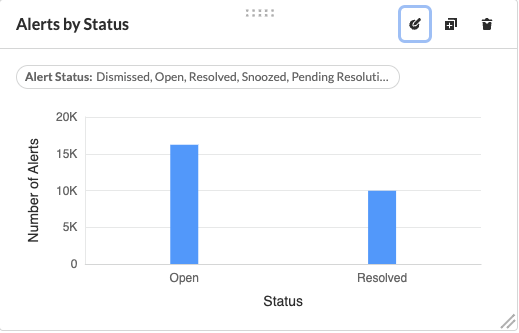 |
| **Alerts by Resolution Reason** | Displays the resolved alerts by their method of resolution. A particular alert will be counted multiple times, if the same alert is resolved several times over multiple days. |
|
| **Alerts by Resolution Reason** | Displays the resolved alerts by their method of resolution. A particular alert will be counted multiple times, if the same alert is resolved several times over multiple days. | 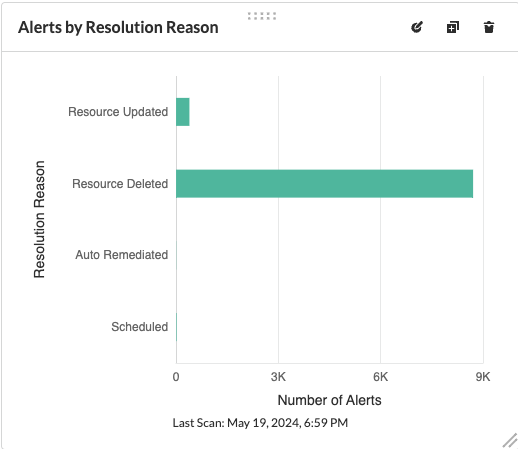 |
| **Alerts by Severity** | Provides a visualization of alerts by Critical, High, Medium, or Low severity. |
|
| **Alerts by Severity** | Provides a visualization of alerts by Critical, High, Medium, or Low severity. | 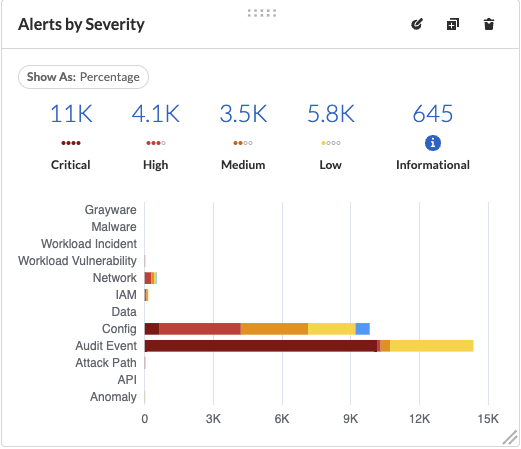 |
| **Anomalous Threats Detected** | Anomalous Threats Detected are organized by UEBA and Network-based anomaly alerts and policies. The top row displays the number of threats detected for UEBA and Network for the past 30/60/90 days. The bottom row displays the number of enabled versus possible policies. |
|
| **Anomalous Threats Detected** | Anomalous Threats Detected are organized by UEBA and Network-based anomaly alerts and policies. The top row displays the number of threats detected for UEBA and Network for the past 30/60/90 days. The bottom row displays the number of enabled versus possible policies. | 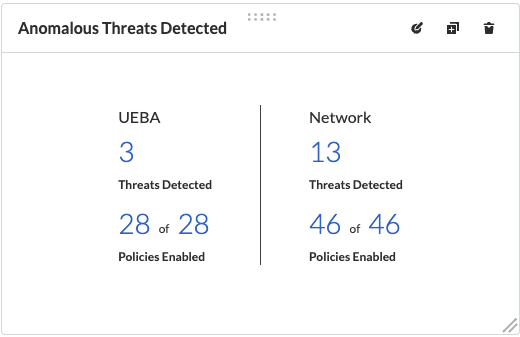 |
| **Assets by Classification** | Provides a visualization of assets by cloud type, account name, region, or service type. |
|
| **Assets by Classification** | Provides a visualization of assets by cloud type, account name, region, or service type. | 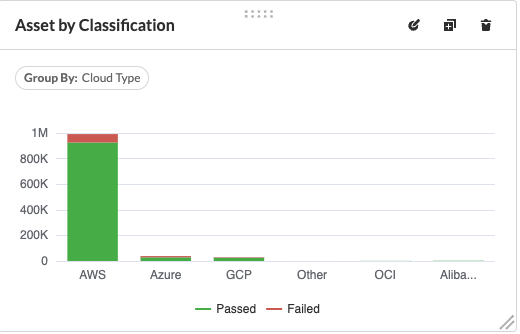 |
| **Asset Inventory Overview** | Provides an overview of all assets and their alerts by severity. |
|
| **Asset Inventory Overview** | Provides an overview of all assets and their alerts by severity. | 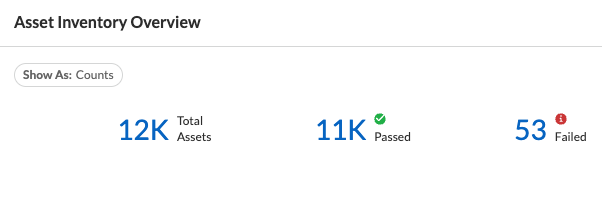 |
| **Asset Trend** |
|
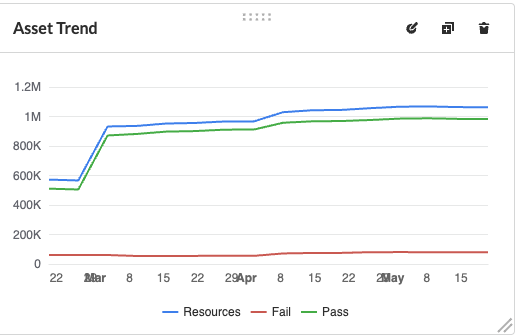
| **Asset Trend** | Provides the total number of assets and passing or failing assets for the last 90 days.
The Asset Trend widget is not available on all tenants. If you want this widget enabled, contact Prisma Cloud Customer Support.
| |
| **Assets with Alerts** | Displays the count of risks detected for all policy violations such as Network, Anomaly, Audit Event, and Config policies by a tenant and the assets producing these alerts over a period of time. |
|
| **Assets with Alerts** | Displays the count of risks detected for all policy violations such as Network, Anomaly, Audit Event, and Config policies by a tenant and the assets producing these alerts over a period of time. | 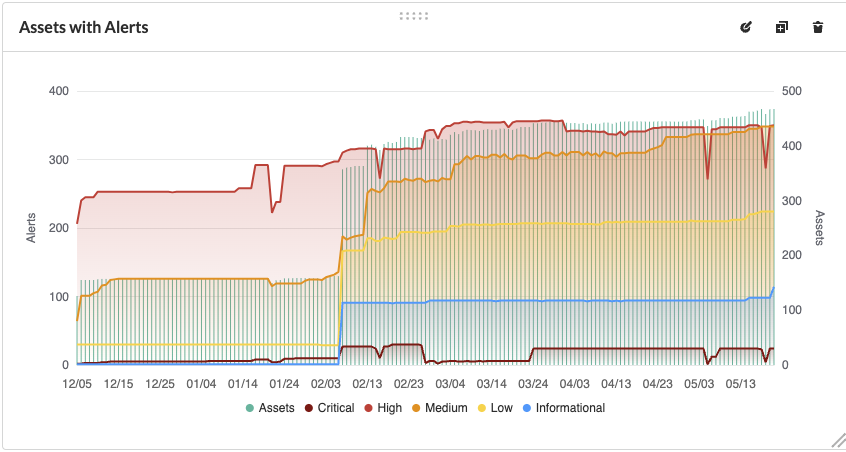 |
| **Code & Build Burndown and Inventory** | Trend line of code issues over the last 30 days and Code & Build inventory snapshot of repositories. |
|
| **Code & Build Burndown and Inventory** | Trend line of code issues over the last 30 days and Code & Build inventory snapshot of repositories. | 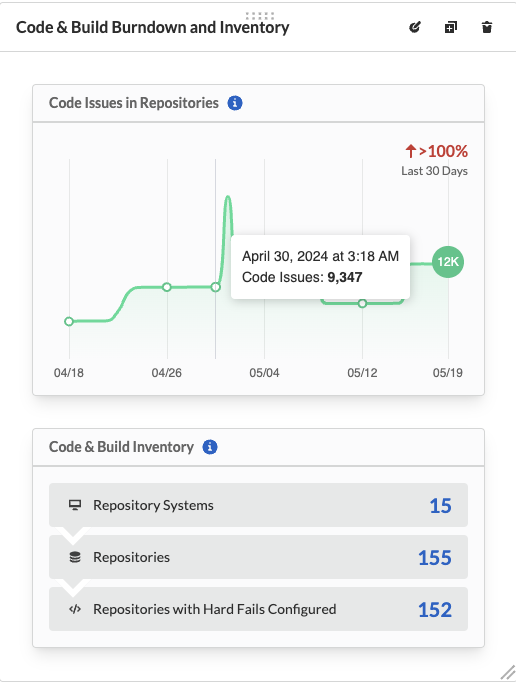 |
| **Code Issues from Latest Branch Scans Over Time** | A trend line of code issues over time from the latest branch scans. |
|
| **Code Issues from Latest Branch Scans Over Time** | A trend line of code issues over time from the latest branch scans. | 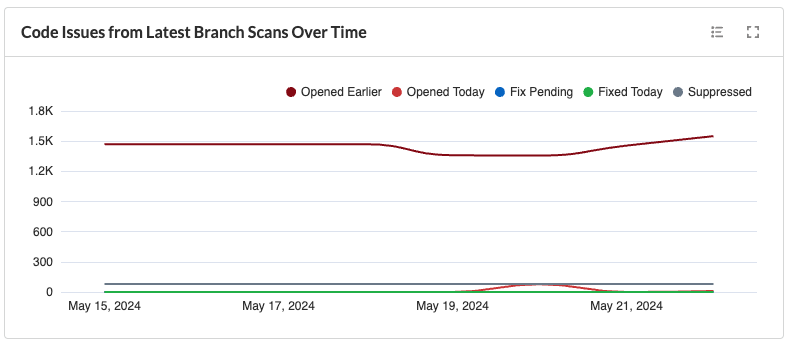 |
| **Code Review Issues Over Time** | A trend line of code issues over time tracking the number of issues blocked or scanned as part of VCS pull requests. |
|
| **Code Review Issues Over Time** | A trend line of code issues over time tracking the number of issues blocked or scanned as part of VCS pull requests. | 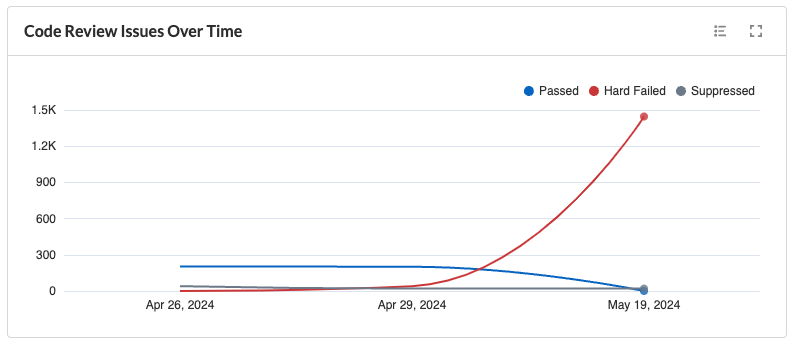 |
| **Code Vulnerabilities from Latest Branch Scans Over Time** | Tracks latest vulnerabilities detected in branch scans. |
|
| **Code Vulnerabilities from Latest Branch Scans Over Time** | Tracks latest vulnerabilities detected in branch scans. | 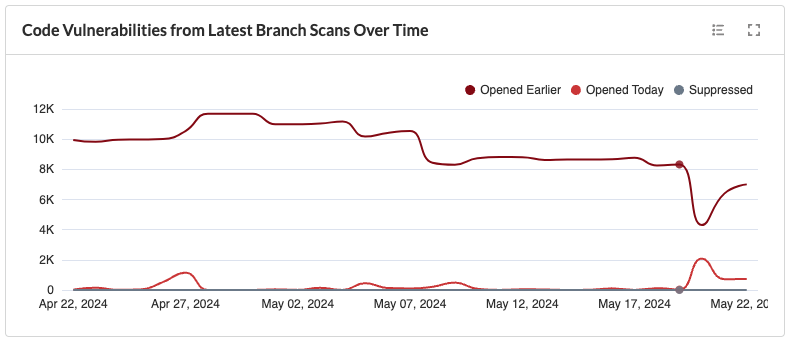 |
| **Compliance Coverage** | Top failing compliance standards. |
|
| **Compliance Coverage** | Top failing compliance standards. | 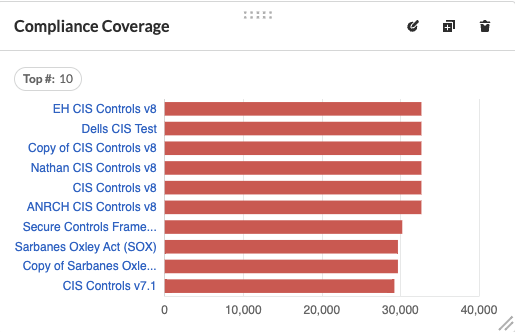 |
| **Compliance Overview** | Displays the overall health of cloud resources in an organization. |
|
| **Compliance Overview** | Displays the overall health of cloud resources in an organization. | 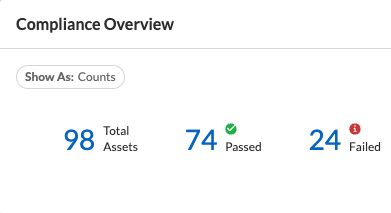 |
| **Compliance Trend** |
|
| **Compliance Trend** | Compliance posture trend over time.
(If you select Time Range > Custom, only the Start Date day will be applied to the widget and the hourly timestamp will be disregarded. In addition, the End Date is always set to the current date, regardless of your selection.)
The Compliance Trend widget is not available on all tenants. If you want this widget enabled, contact Prisma Cloud Customer Support.
|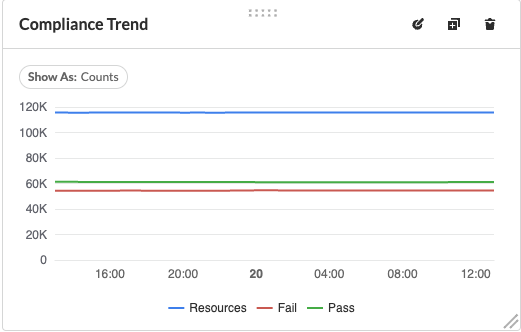 |
| **Deploy Burndown and Inventory** | Trend line of urgent vulnerabilities over the last 30 days and Deploy inventory snapshot of registries and container images. |
|
| **Deploy Burndown and Inventory** | Trend line of urgent vulnerabilities over the last 30 days and Deploy inventory snapshot of registries and container images. | 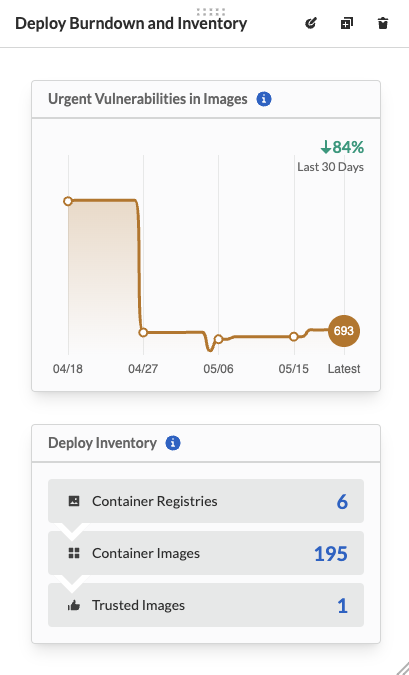 |
| **Discovered vs Secured Resources** | Displays the extent to which the Defender is currently protecting your cloud environment. It shows the number of resources detected by Cloud Discovery as well as the number of Secured resources protected by deployed Defenders over a period of time. |
|
| **Discovered vs Secured Resources** | Displays the extent to which the Defender is currently protecting your cloud environment. It shows the number of resources detected by Cloud Discovery as well as the number of Secured resources protected by deployed Defenders over a period of time. | 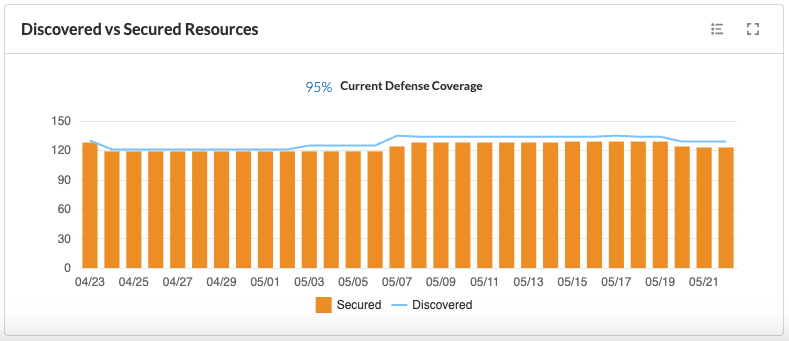 |
| **Errors by Severity** | Summary of all code issues by severity. |
|
| **Errors by Severity** | Summary of all code issues by severity. | 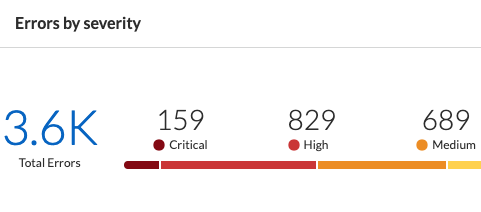 |
| **IaC Issues by Category** | Total count of IaC misconfigurations by category. |
|
| **IaC Issues by Category** | Total count of IaC misconfigurations by category. | 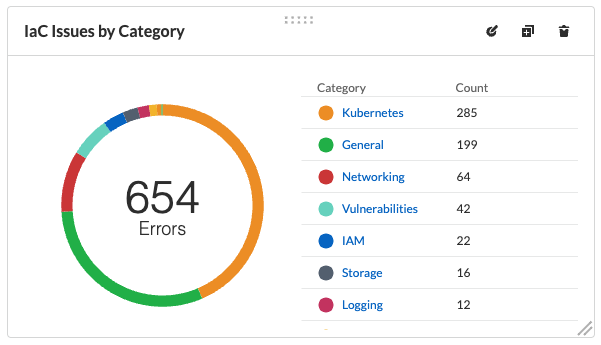 |
| **Incidents Burndown** | Displays the last 30/60/90 days of critical and high severity alerts generated from Network, Anomaly, and Audit Events against the assets across your monitored cloud environments and your team’s progress on remediating these incidents. The remediation actions include the states of resolve, dismiss or snooze. |
|
| **Incidents Burndown** | Displays the last 30/60/90 days of critical and high severity alerts generated from Network, Anomaly, and Audit Events against the assets across your monitored cloud environments and your team’s progress on remediating these incidents. The remediation actions include the states of resolve, dismiss or snooze. | 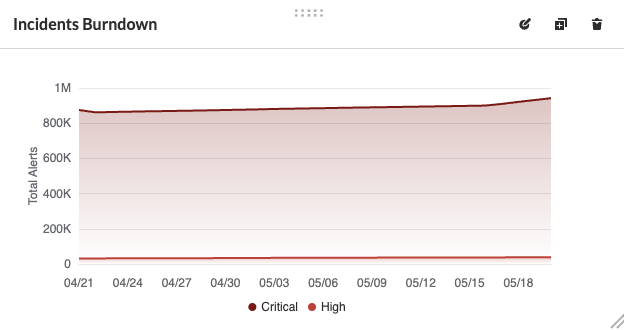 |
| **Internet Connected Assets by Traffic Location** | Displays internet connected assets by region and provides a closer look at asset relationships. |
|
| **Internet Connected Assets by Traffic Location** | Displays internet connected assets by region and provides a closer look at asset relationships. | 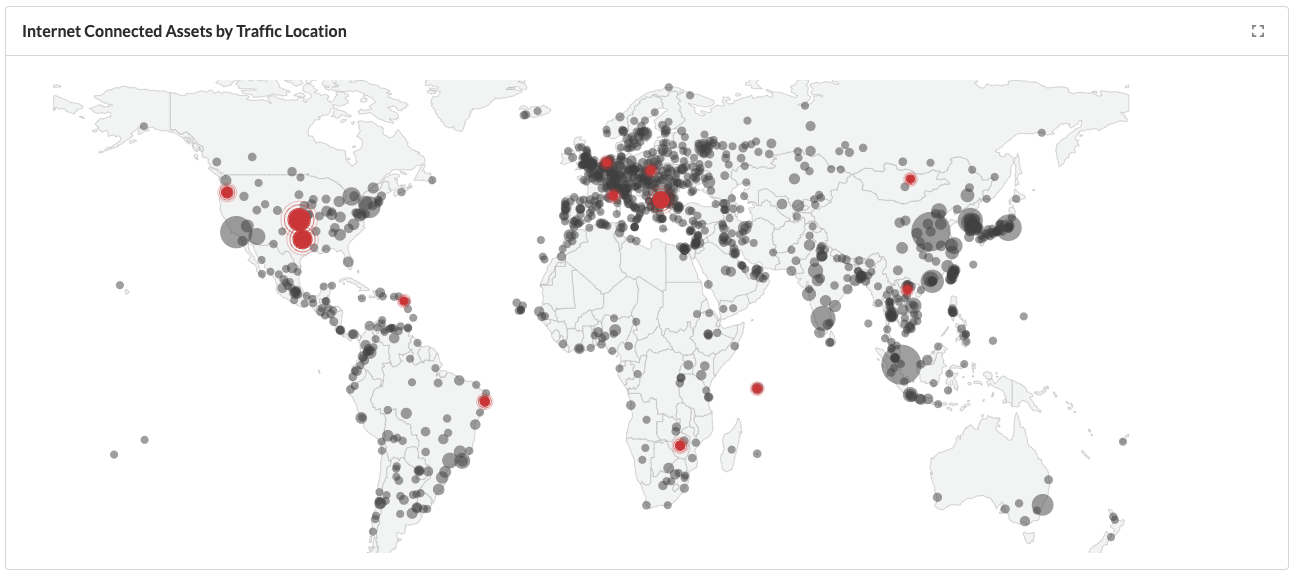 |
| **Internet Exposed Unmanaged Assets** | Top internet exposed unmanaged assets over time. |
|
| **Internet Exposed Unmanaged Assets** | Top internet exposed unmanaged assets over time. | 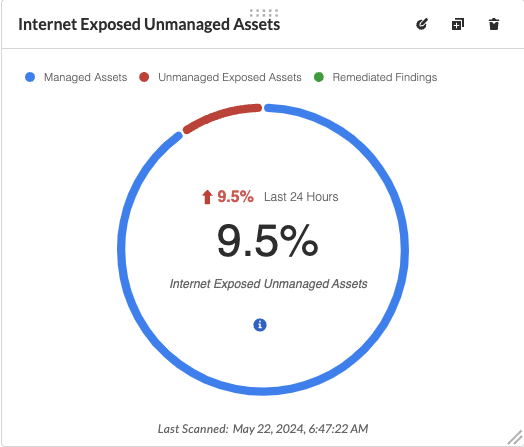 |
| **Latest Code Review Scans** | Lists 1K latest code scans of VCS pull requests and CI/CD runs. |
|
| **Latest Code Review Scans** | Lists 1K latest code scans of VCS pull requests and CI/CD runs. | 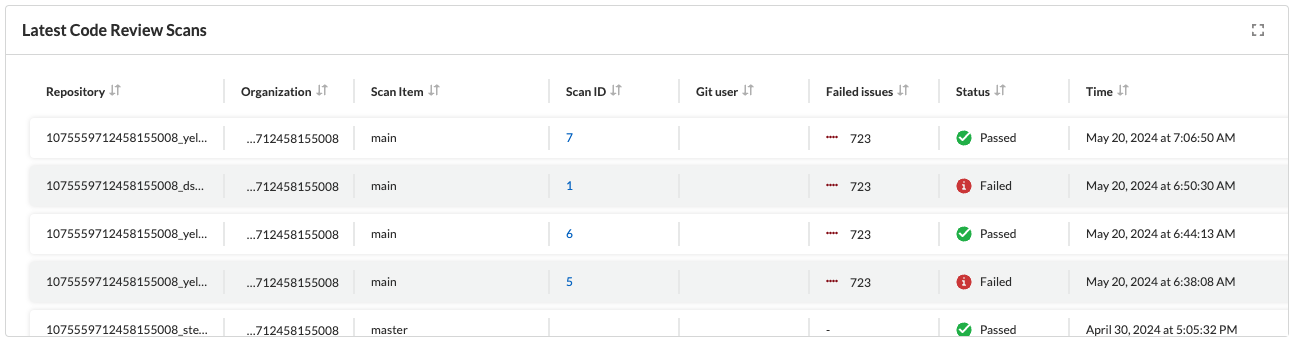 |
| **Most Common Code Issues by Policy** | Displays the most common policy issues in code category of IaC Misconfigurations, secrets, and licensing. View the corresponding severity, issue count, and labels like **Has Fix** or **Custom Policy** to take informed business decisions. |
|
| **Most Common Code Issues by Policy** | Displays the most common policy issues in code category of IaC Misconfigurations, secrets, and licensing. View the corresponding severity, issue count, and labels like **Has Fix** or **Custom Policy** to take informed business decisions. | 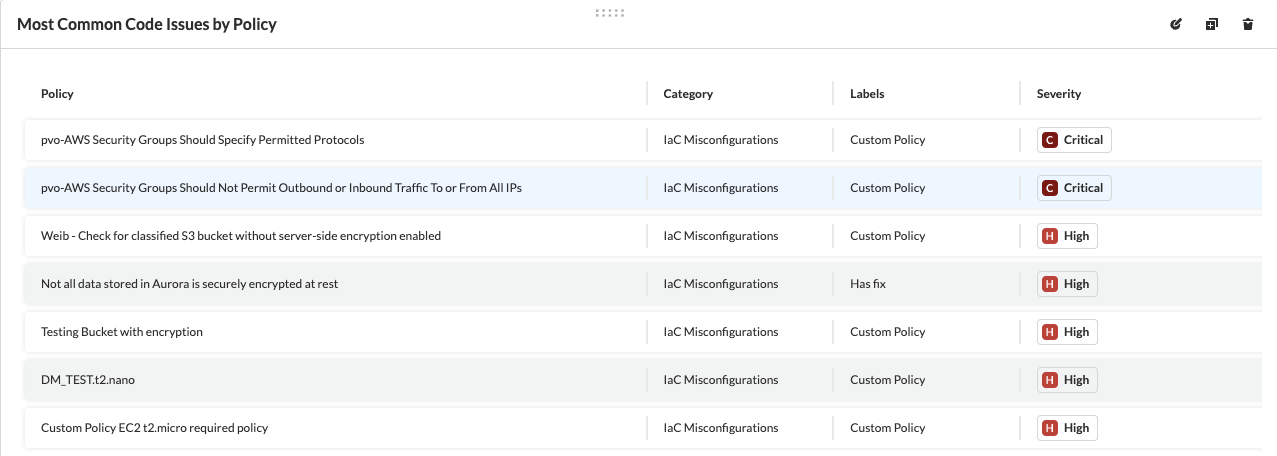 |
| **Object Data Profile by Region** | Displays object profiles such as Financial Information, Healthcare, PII and Intellectual Property across AWS Regions. |
|
| **Object Data Profile by Region** | Displays object profiles such as Financial Information, Healthcare, PII and Intellectual Property across AWS Regions. | 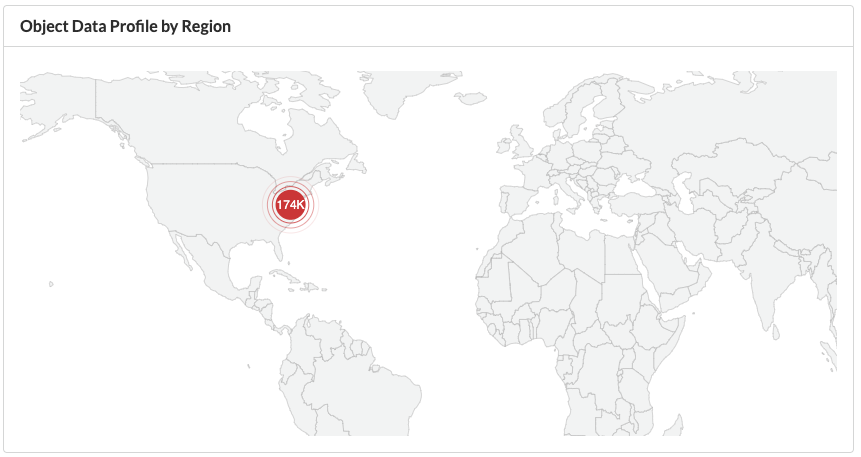 |
| **Open Alerts Over Time** | Displays the number of alerts that were opened within a selected time period. |
|
| **Open Alerts Over Time** | Displays the number of alerts that were opened within a selected time period. | 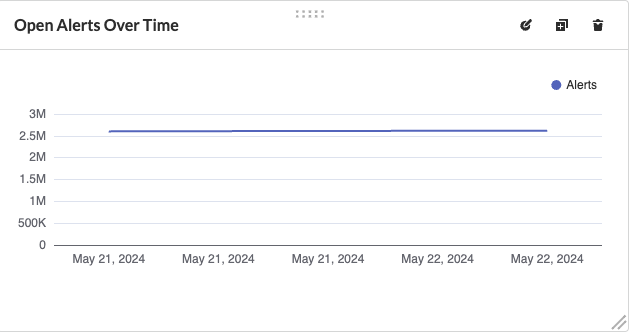 |
| **Policies by Severity** | Provides a visualization of policies by severity and type. |
|
| **Policies by Severity** | Provides a visualization of policies by severity and type. | 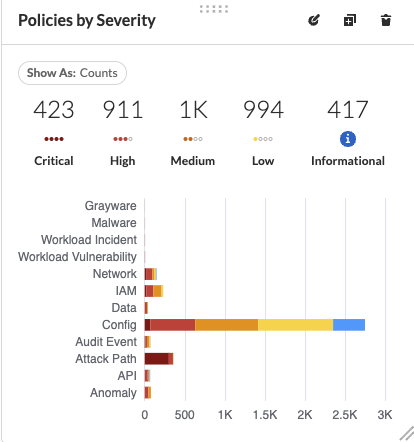 |
| **Policies Drilldown** | Provides the snapshot policy count for Incidents and Risks and the top 5 policies by alerts. |
|
| **Policies Drilldown** | Provides the snapshot policy count for Incidents and Risks and the top 5 policies by alerts. | 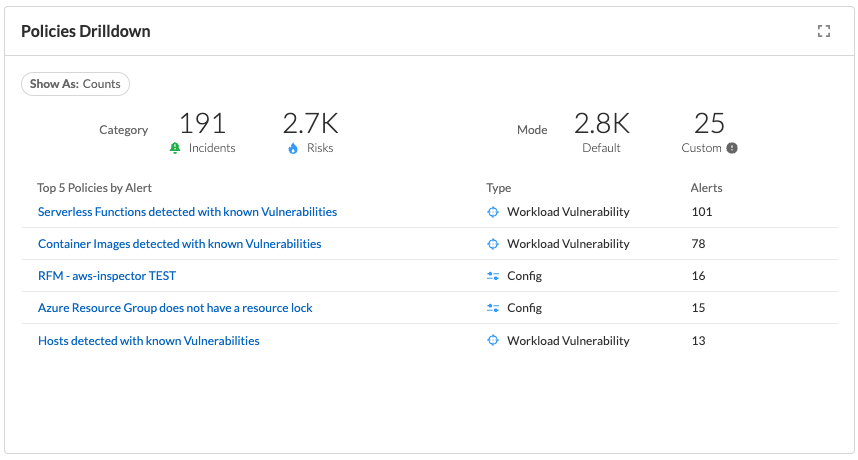 |
| **Policy Coverage** | Provides a visualization of total enabled polices by type. |
|
| **Policy Coverage** | Provides a visualization of total enabled polices by type. | 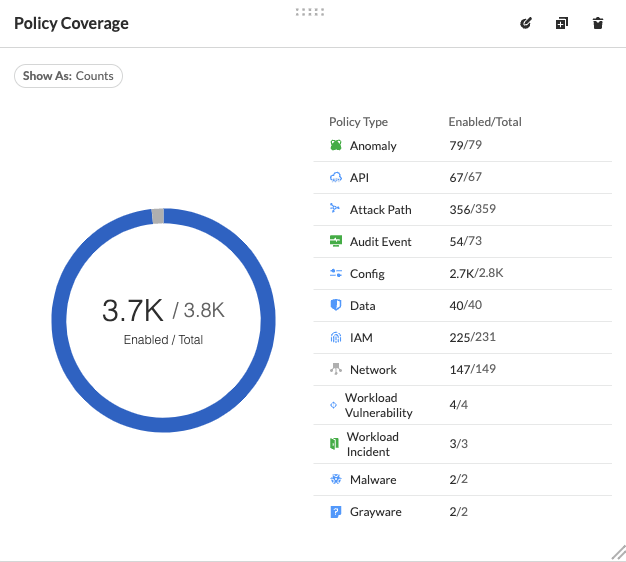 |
| **Prioritized Vulnerabilities** | Prioritized vulnerabilities data over time. |
|
| **Prioritized Vulnerabilities** | Prioritized vulnerabilities data over time. | 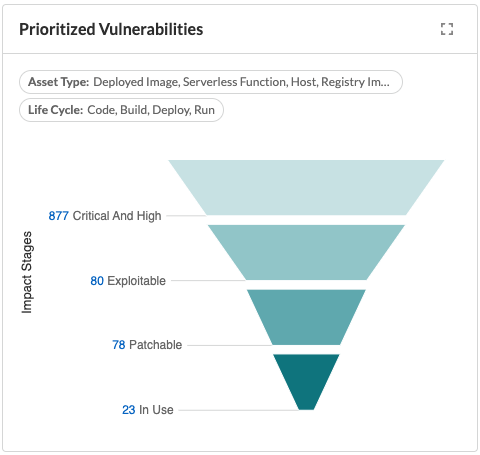 |
| **Risk Burndown** | Displays the number of critical and high severity risks detected using the Configuration policies on Prisma Cloud and your team’s progress on addressing these risks. The addressed actions include the states of resolve, dismiss or snooze. |
|
| **Risk Burndown** | Displays the number of critical and high severity risks detected using the Configuration policies on Prisma Cloud and your team’s progress on addressing these risks. The addressed actions include the states of resolve, dismiss or snooze. | 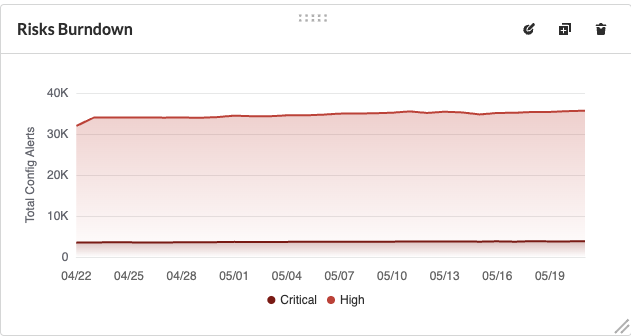 |
| **Runtime Burndown and Inventory** | Trend line of urgent incidents and attack paths over the last 30 days and Runtime inventory snapshot of cloud assets and workloads. |
|
| **Runtime Burndown and Inventory** | Trend line of urgent incidents and attack paths over the last 30 days and Runtime inventory snapshot of cloud assets and workloads. | 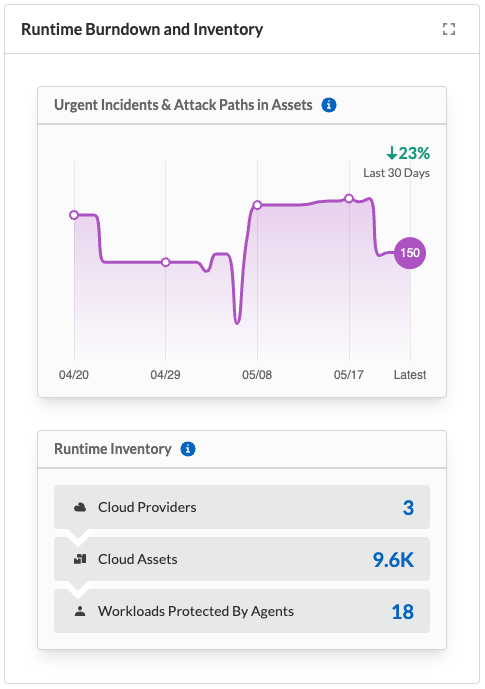 |
| **Security Events Stream** | Latest 50 events detected in your cloud estate. |
|
| **Security Events Stream** | Latest 50 events detected in your cloud estate. |  |
| **Top Assets by Role** | Summarizes top open ports in your cloud environments and the percentage of traffic directed at each type of port. |
|
| **Top Assets by Role** | Summarizes top open ports in your cloud environments and the percentage of traffic directed at each type of port. | 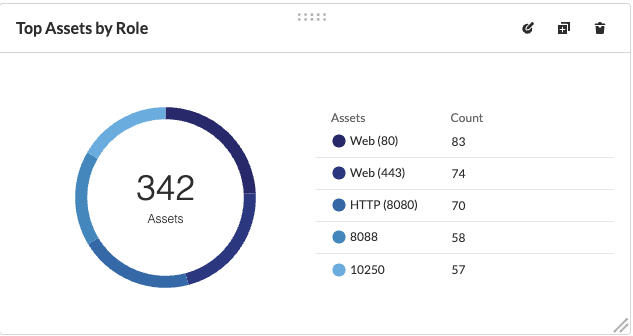 |
| **Top Attack Path by Asset** | Lists the top five attack paths by asset name, number of alerts, cloud service, and account name. |
|
| **Top Attack Path by Asset** | Lists the top five attack paths by asset name, number of alerts, cloud service, and account name. | 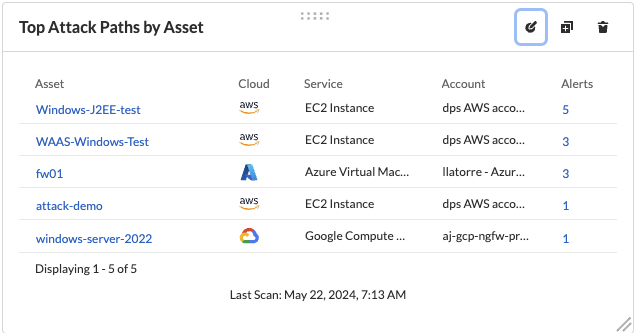 |
| **Top Attack Path By Policy** | Provides the top five attack path policies that triggered an alert. |
|
| **Top Attack Path By Policy** | Provides the top five attack path policies that triggered an alert. | 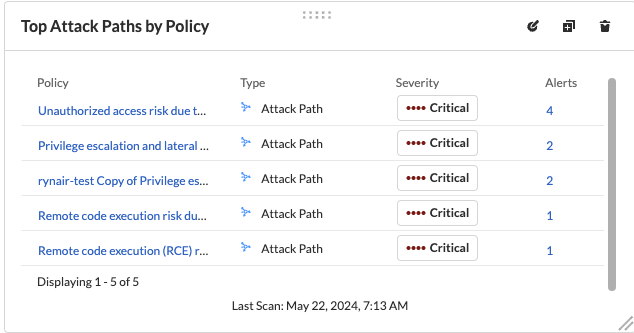 |
| **Top Code & Build, Deploy, Runtime Issues by Collection** | Lists top issues by Team, Business Unit, and App using Collections. |
|
| **Top Code & Build, Deploy, Runtime Issues by Collection** | Lists top issues by Team, Business Unit, and App using Collections. | 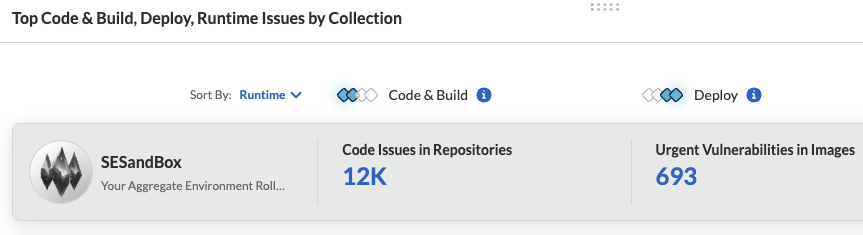 |
| **Top Custom Alerts** | Displays the top three custom policies by open alert count, highlighting the threats and misconfigurations you are catching through these policies. |
|
| **Top Custom Alerts** | Displays the top three custom policies by open alert count, highlighting the threats and misconfigurations you are catching through these policies. | 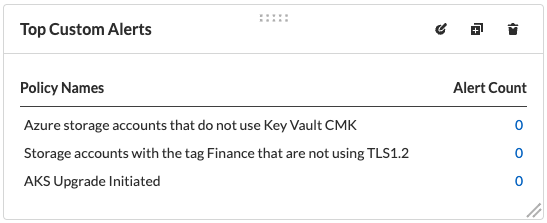 |
| **Top CVSS Score Code Vulnerabilities** | Lists code vulnerabilities with the highest CVSS score to help you discover and prioritize them using the Risk Factor, Severity and issue count. |
|
| **Top CVSS Score Code Vulnerabilities** | Lists code vulnerabilities with the highest CVSS score to help you discover and prioritize them using the Risk Factor, Severity and issue count. | 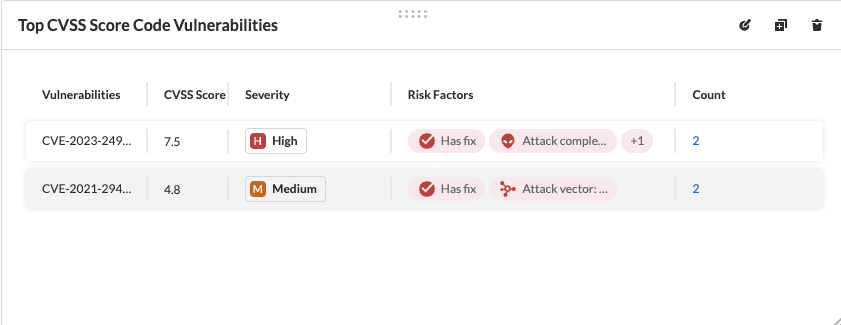 |
| **Top Data Risks by Asset** | Provides top five data risks by the assets they are connected to. |
|
| **Top Data Risks by Asset** | Provides top five data risks by the assets they are connected to. | 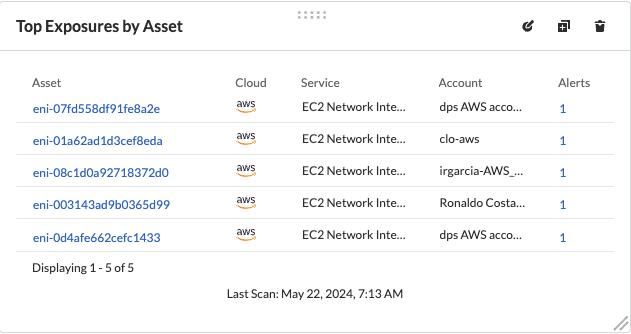 |
| **Top Exposure by Policy** | Lists the top five policies that triggered an exposure. |
|
| **Top Exposure by Policy** | Lists the top five policies that triggered an exposure. | 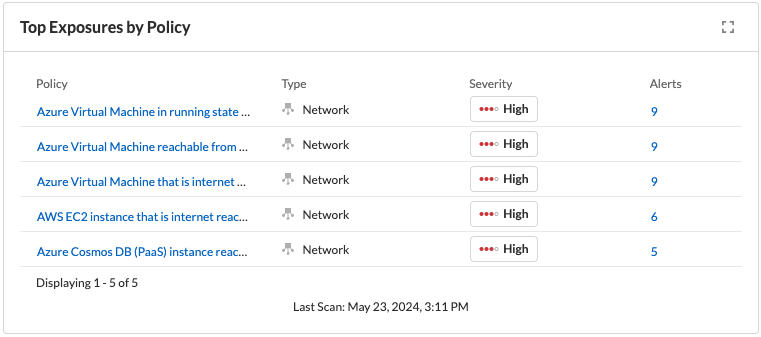 |
| **Top Identity Risks by Asset** | Lists the top five identity risks by asset name, cloud type, service, account group and number of alerts. |
|
| **Top Identity Risks by Asset** | Lists the top five identity risks by asset name, cloud type, service, account group and number of alerts. | 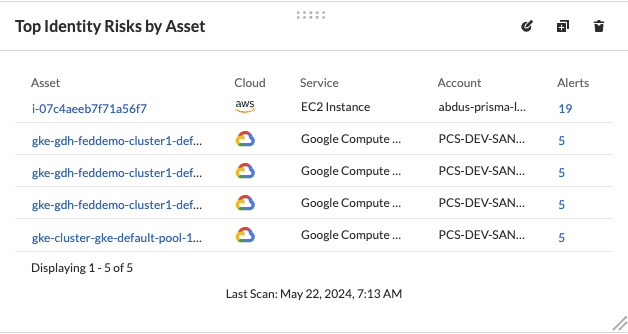 |
| **Top Identity Risks by Policy** | Lists the top five policies that triggered an IAM alert. |
|
| **Top Identity Risks by Policy** | Lists the top five policies that triggered an IAM alert. | 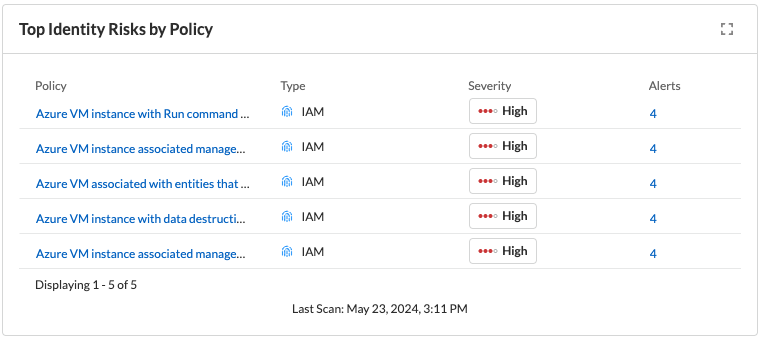 |
| **Top Impacting Vulnerbilities** | Top Impacting Vulnerbilities data over time. |
|
| **Top Impacting Vulnerbilities** | Top Impacting Vulnerbilities data over time. | 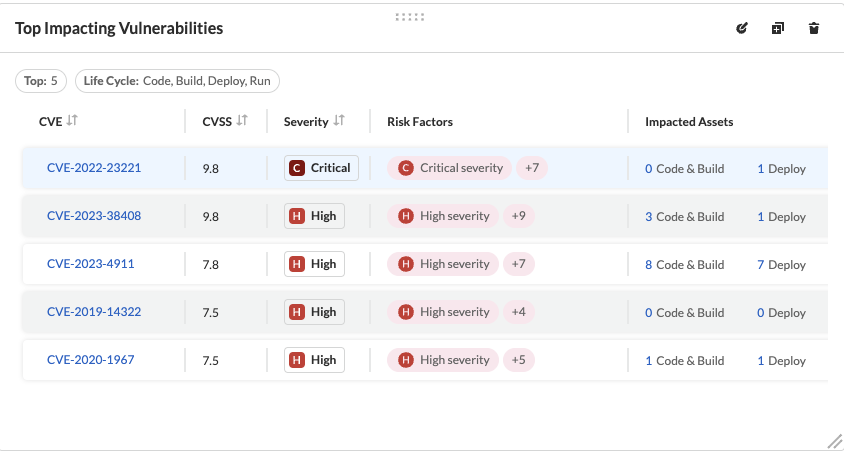 |
| **Top Incidents & Risks** | Lists the top five incidents and risks by policy type and number of alerts. |
|
| **Top Incidents & Risks** | Lists the top five incidents and risks by policy type and number of alerts. | 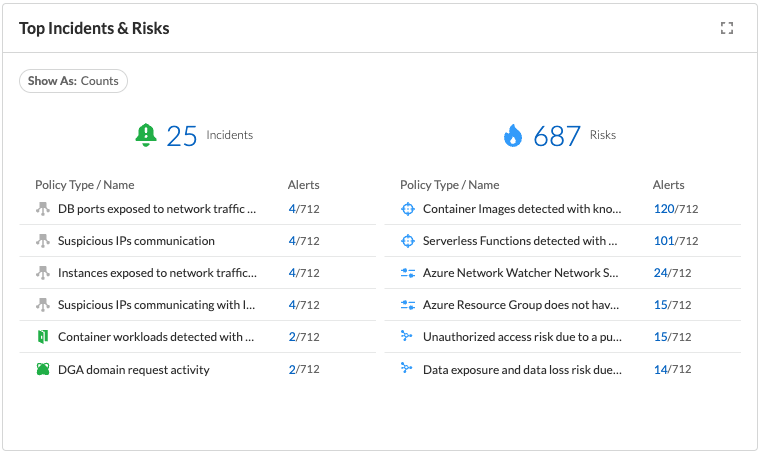 |
| **Top Incidents & Risks by MITRE ATT\&CK** | Lists the top five incidents and risks mapped to the MITRE Framework. |
|
| **Top Incidents & Risks by MITRE ATT\&CK** | Lists the top five incidents and risks mapped to the MITRE Framework. | 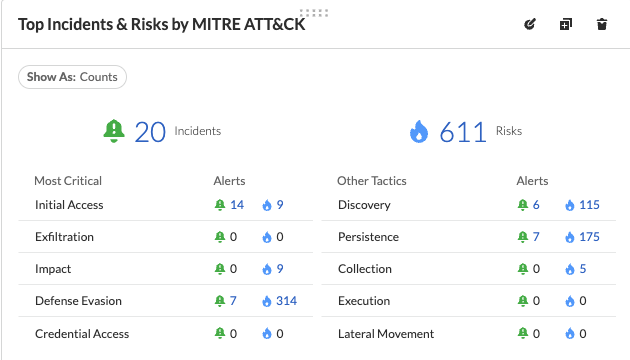 |
| **Top Incidents by Asset** | Lists top five incidents by asset name, number of alerts, cloud service, and account name. |
|
| **Top Incidents by Asset** | Lists top five incidents by asset name, number of alerts, cloud service, and account name. | 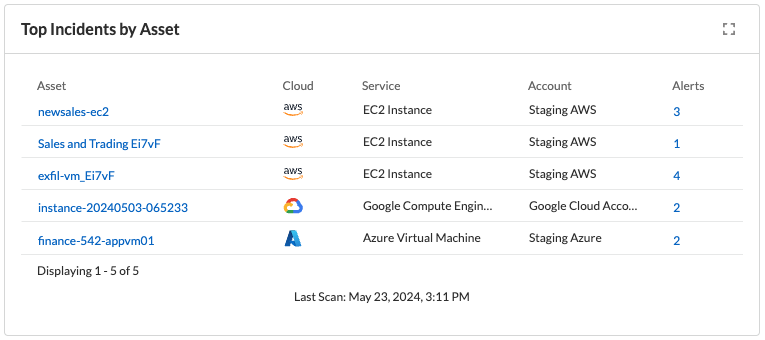 |
| **Top Incident By Policy** | Lists the top five policies that triggered an alert. |
|
| **Top Incident By Policy** | Lists the top five policies that triggered an alert. | 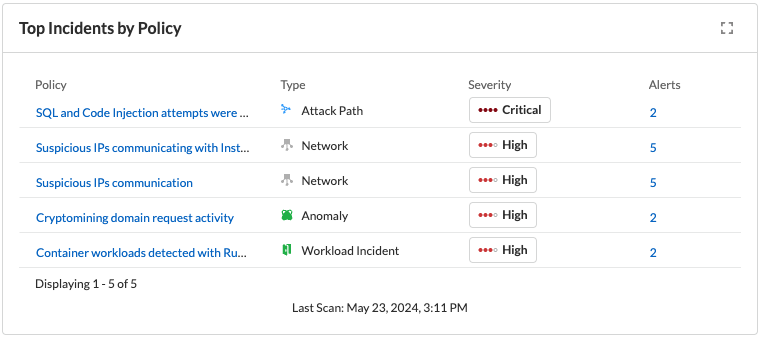 |
| **Top Insecure Repositories** | Top seven repositories with the highest Critical and High severity issue count. |
|
| **Top Insecure Repositories** | Top seven repositories with the highest Critical and High severity issue count. | 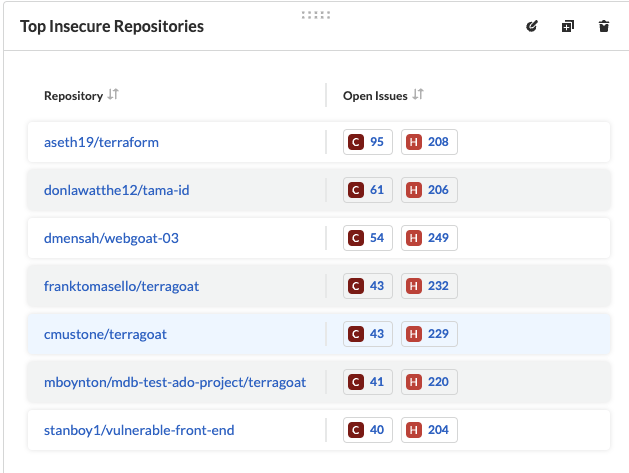 |
| **Top Internet Trafficked Assets by Traffic Type** | Displays top Internet connected assets by traffic type. |
|
| **Top Internet Trafficked Assets by Traffic Type** | Displays top Internet connected assets by traffic type. | 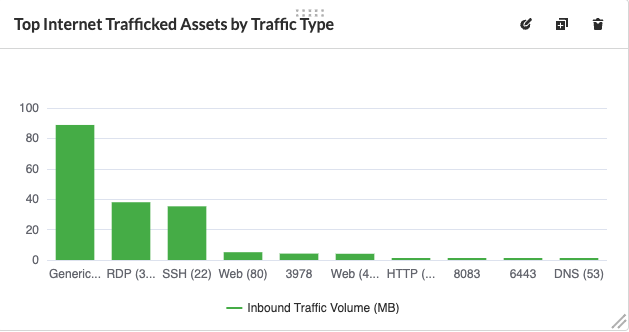 |
| **Top Misconfigurations by Asset** | Lists top five misconfigurations by asset name, number of alerts, service, and account name. |
|
| **Top Misconfigurations by Asset** | Lists top five misconfigurations by asset name, number of alerts, service, and account name. | 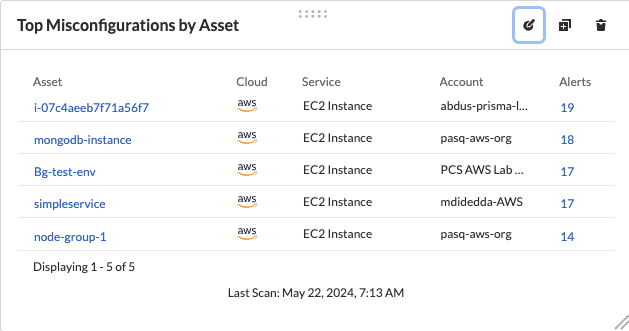 |
| **Top Misconfigurations by Policy** | Lists the top five policies that triggered a misconfiguration. |
|
| **Top Misconfigurations by Policy** | Lists the top five policies that triggered a misconfiguration. | 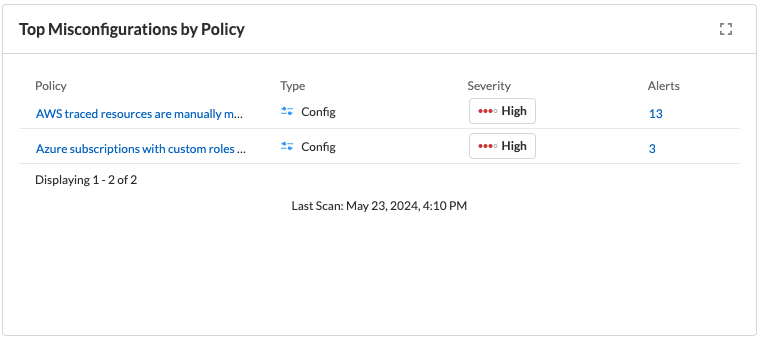 |
| **Top Non-Compliant Package Licenses** | Identifies the frequently occurring non-compliant package licenses within repositories. |
|
| **Top Non-Compliant Package Licenses** | Identifies the frequently occurring non-compliant package licenses within repositories. | 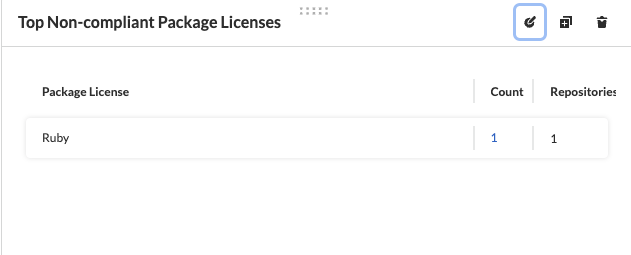 |
| **Top Publicly Exposed Objects By Data Profile** | Displays the five publicly exposed objects with Data Profiles of Financial Information, Healthcare, PII and Intellectual Property. |
|
| **Top Publicly Exposed Objects By Data Profile** | Displays the five publicly exposed objects with Data Profiles of Financial Information, Healthcare, PII and Intellectual Property. | 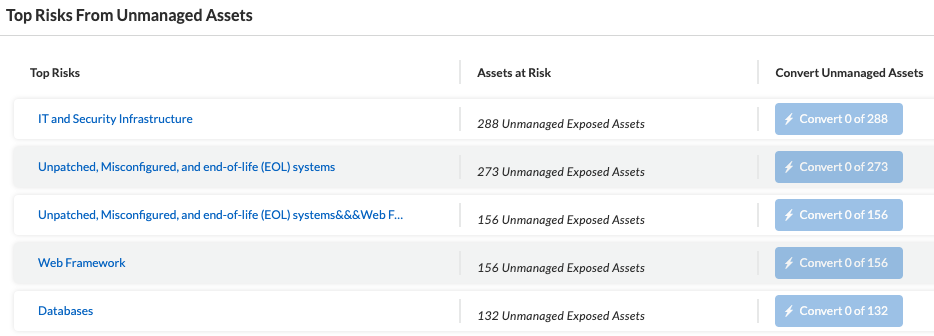 |
| **Top Vulnerable Hosts** | Lists the top five vulnerable hosts. |
|
| **Top Vulnerable Hosts** | Lists the top five vulnerable hosts. | 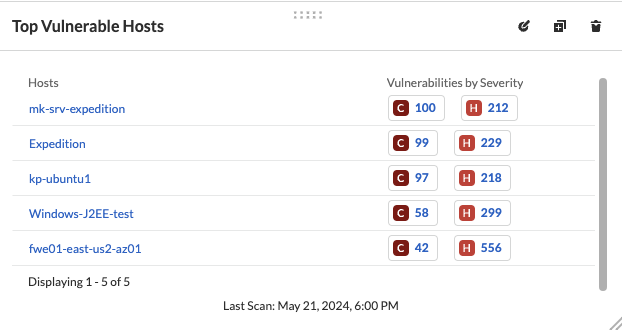 |
| **Top Vulnerable Images** | Lists the top five vulnerable images. |
|
| **Top Vulnerable Images** | Lists the top five vulnerable images. | 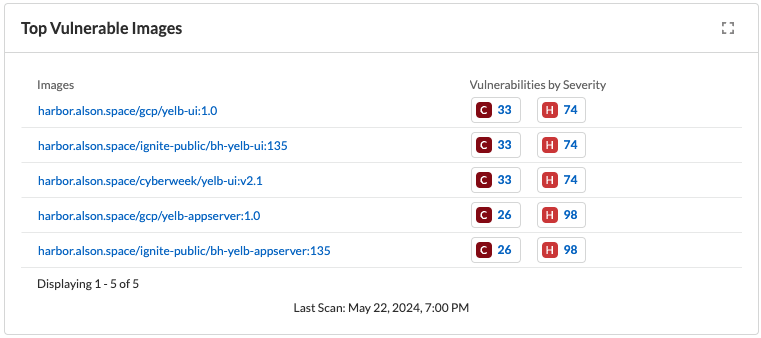 |
| **Total Objects** | Displays the total number of objects discovered in all your S3 storage buckets. |
|
| **Total Objects** | Displays the total number of objects discovered in all your S3 storage buckets. | 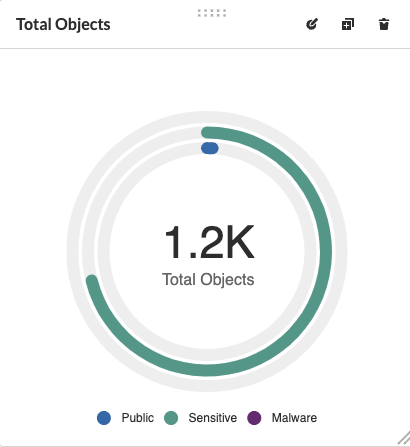 |
| **Total Resources** | Provides a visualization of total resources. |
|
| **Total Resources** | Provides a visualization of total resources. | 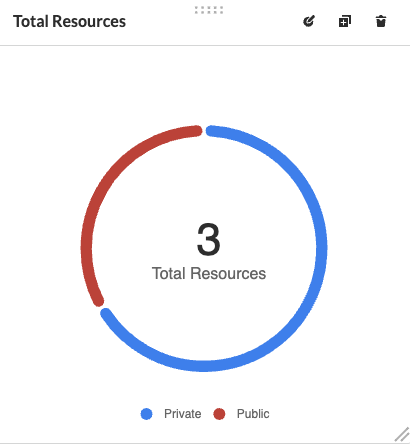 |
| **Total Urgent Issues** | Provides a tally of urgent issues grouped by Incidents, Exposures, Misconfigurations, Identity, and Data Risks. |
|
| **Total Urgent Issues** | Provides a tally of urgent issues grouped by Incidents, Exposures, Misconfigurations, Identity, and Data Risks. | 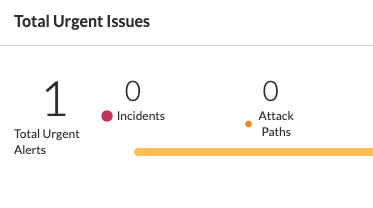 |
| **Unamanaged and Managed Asset Trend** | Tally of unamanaged and managed asset data over time. |
|
| **Unamanaged and Managed Asset Trend** | Tally of unamanaged and managed asset data over time. | 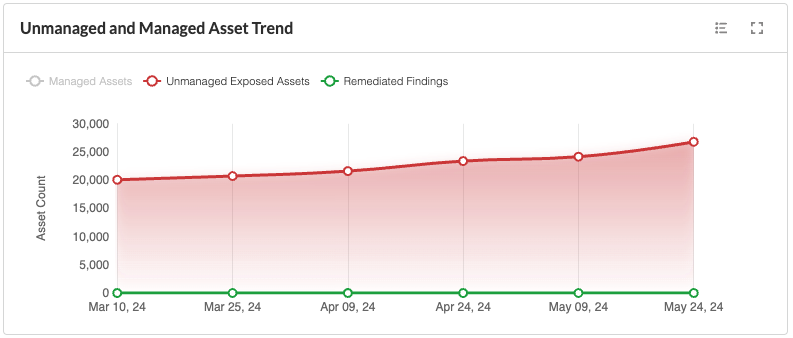 |
| **Unamanaged Exposed Assets by Country** | Tally of exposed assets by country over time. |
|
| **Unamanaged Exposed Assets by Country** | Tally of exposed assets by country over time. | 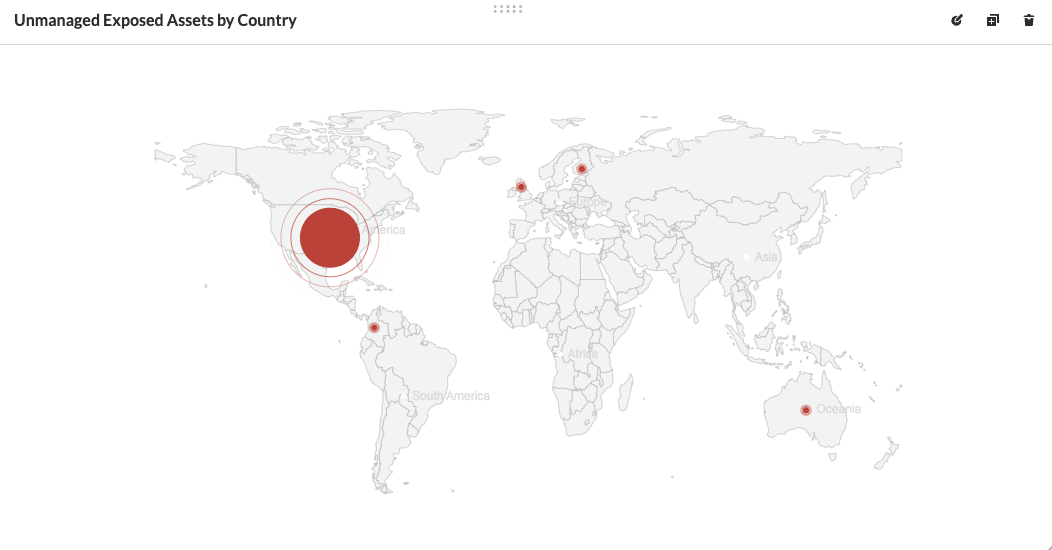 |
| **Urgent Alerts** | Provides a visualization of Critical, and High severity incidents. |
|
| **Urgent Alerts** | Provides a visualization of Critical, and High severity incidents. | 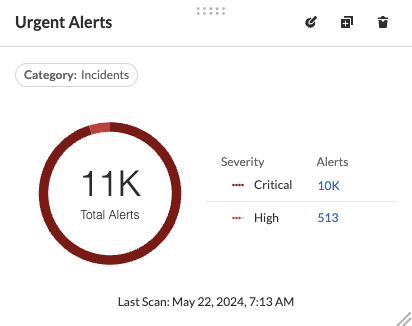 |
| **Urgent Vulnerabilities** | Provides a visualization of Critical, and High severity vulnerabilities. |
|
| **Urgent Vulnerabilities** | Provides a visualization of Critical, and High severity vulnerabilities. | 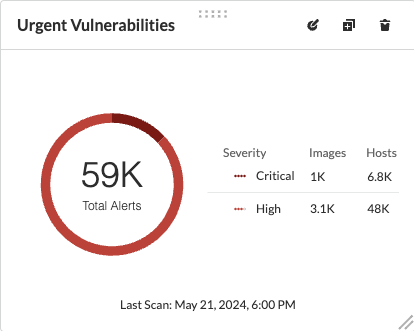 |
| **VCS Pull Requests Over Time** | Analyzes the impact of Enforcement rules on new code deliveries. Observe the adoption of secure coding practices over time, including the reduction of failed PRs. |
|
| **VCS Pull Requests Over Time** | Analyzes the impact of Enforcement rules on new code deliveries. Observe the adoption of secure coding practices over time, including the reduction of failed PRs. | 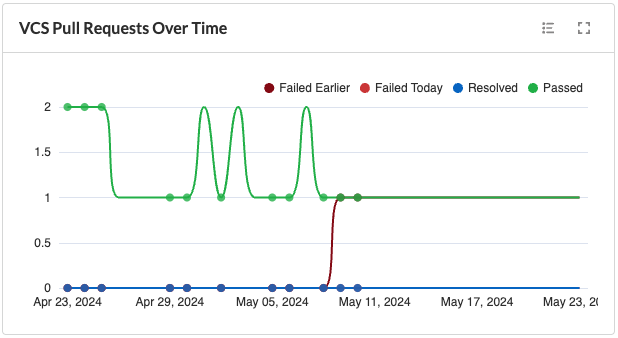 |
| **Vulnerabilities Overview** | Top vulnerabilities data over time. |
|
| **Vulnerabilities Overview** | Top vulnerabilities data over time. | 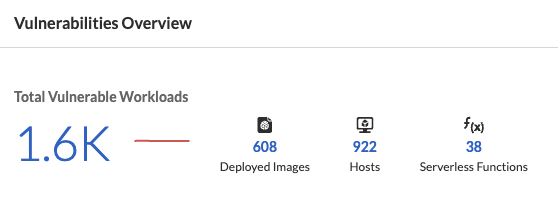 |
| **Vulnerabilities Trends** | Displays the vulnerabilities discovered and resolved over time across images, hosts, containers and functions for the impacted resources. |
|
| **Vulnerabilities Trends** | Displays the vulnerabilities discovered and resolved over time across images, hosts, containers and functions for the impacted resources. | 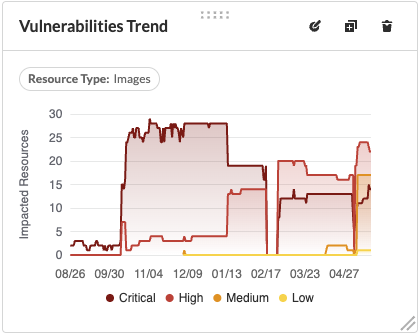 |
| **Vulnerability Impact by Stage** | Displays vulnerability impact data over time. |
|
| **Vulnerability Impact by Stage** | Displays vulnerability impact data over time. |  |
## Manage Dashboards
Follow the steps below to manage the dashboards you’ve created.
1. Select **Manage Dashboards** to clone or delete any existing dashboard.
1. Select the dashboard you want to delete from the drop-down list and select **Clone** or **Delete**.
2. Select the action button on any dashboard to easily copy or delete the selected dashboard.
System generated dashboards available out of the box cannot be deleted.
## Share Dashboards
Share the custom dashboards you have created with members of your organization or tenant to further collaboration and communication. Once you’ve configured the dashboard access levels, sharing is as simple as providing the URL to your team. The steps below capture the workflow:
1. Select **Dashboards** from the Prisma Cloud administrative console. Make a note of the Prisma Cloud switcher mode you are on. For instance, Cloud, Runtime or Application Security. Custom dashboards created in a specific mode are only viewable in that mode.
2. **Share Dashboards: Update Access Setting**
1. Select the **Menu** dropdown from the **Dashboards** navigation menu.
2. Click the actions menu to the left of your custom dashboard and select **Share**.
3. Select **Public** from the **Access Settings** drop-down and click **Update**.
4. Share the URL of your dashboard with anyone in your organization to provide access.
3. Optionally, follow the steps below to help your users discover the Dashboard you’ve created:
1. We recommend that you guide users to toggle on the the **Visibility** setting of the shared Dashboard under **Dashboards> Menu > Manage Dashboards**.
2. Once the dashboard is shared globally, it will appear by default at the bottom of the **Manage Dashboards** list and can be reordered to the top by individual users for easy access. If the user you wish to share a dashboard with, is currently on the Dashboards page, they will also need to refresh the page to see the shared dashboard.
Keep the following caveats in mind when sharing dashboards:
* If you received a shared dashboard URL and haven’t updated the dashboard’s **Visibility** settings, the shared dashboard will only show up temporarily on the Menu tab. To ensure it’s always accessible from the Menu tab follow the steps listed above.
* Users accessing a shared dashboard may see a `permission denied` error message if they do not have the appropriate access levels for individual widgets within the dashboard.
---
# Agent Instructions
This documentation is published with GitBook. GitBook is the documentation platform designed so that both humans and AI agents can read, navigate, and reason over technical content effectively. Learn more at gitbook.com.
## Querying This Documentation
If you need additional information that is not directly available in this page, you can query the documentation by asking a question.
Perform an HTTP GET request on the following URL with the `ask` and `goal` query parameters:
```
GET https://docs.prismacloud.io/content-collections/dashboards/create-and-manage-dashboards.md?ask=
|
## Manage Dashboards
Follow the steps below to manage the dashboards you’ve created.
1. Select **Manage Dashboards** to clone or delete any existing dashboard.
1. Select the dashboard you want to delete from the drop-down list and select **Clone** or **Delete**.
2. Select the action button on any dashboard to easily copy or delete the selected dashboard.
System generated dashboards available out of the box cannot be deleted.
## Share Dashboards
Share the custom dashboards you have created with members of your organization or tenant to further collaboration and communication. Once you’ve configured the dashboard access levels, sharing is as simple as providing the URL to your team. The steps below capture the workflow:
1. Select **Dashboards** from the Prisma Cloud administrative console. Make a note of the Prisma Cloud switcher mode you are on. For instance, Cloud, Runtime or Application Security. Custom dashboards created in a specific mode are only viewable in that mode.
2. **Share Dashboards: Update Access Setting**
1. Select the **Menu** dropdown from the **Dashboards** navigation menu.
2. Click the actions menu to the left of your custom dashboard and select **Share**.
3. Select **Public** from the **Access Settings** drop-down and click **Update**.
4. Share the URL of your dashboard with anyone in your organization to provide access.
3. Optionally, follow the steps below to help your users discover the Dashboard you’ve created:
1. We recommend that you guide users to toggle on the the **Visibility** setting of the shared Dashboard under **Dashboards> Menu > Manage Dashboards**.
2. Once the dashboard is shared globally, it will appear by default at the bottom of the **Manage Dashboards** list and can be reordered to the top by individual users for easy access. If the user you wish to share a dashboard with, is currently on the Dashboards page, they will also need to refresh the page to see the shared dashboard.
Keep the following caveats in mind when sharing dashboards:
* If you received a shared dashboard URL and haven’t updated the dashboard’s **Visibility** settings, the shared dashboard will only show up temporarily on the Menu tab. To ensure it’s always accessible from the Menu tab follow the steps listed above.
* Users accessing a shared dashboard may see a `permission denied` error message if they do not have the appropriate access levels for individual widgets within the dashboard.
---
# Agent Instructions
This documentation is published with GitBook. GitBook is the documentation platform designed so that both humans and AI agents can read, navigate, and reason over technical content effectively. Learn more at gitbook.com.
## Querying This Documentation
If you need additional information that is not directly available in this page, you can query the documentation by asking a question.
Perform an HTTP GET request on the following URL with the `ask` and `goal` query parameters:
```
GET https://docs.prismacloud.io/content-collections/dashboards/create-and-manage-dashboards.md?ask=