> For the complete documentation index, see [llms.txt](https://docs.prismacloud.io/llms.txt). Markdown versions of documentation pages are available by appending `.md` to page URLs; this page is available as [Markdown](https://docs.prismacloud.io/content-collections/dashboards/dashboards-application-security.md).
# Application Security Dashboard
As a part of Application Security, the Code Security dashboard provides you with a contextual view of the top code security vulnerabilities and misconfigurations identified in scans across the code and build integrations on Prisma Cloud. It gives you a contextual understanding of high priority errors that require attention across these vectors:
* High-risk code errors by severity
* Historical data for code issues and pull requests
* Common policy errors
* Licensing errors in non-compliant packages
* IaC errors in code categories
* Vulnerabilities seen in CVE from CVSS score
You can view the dashboard on **Dashboards > Code Security**. The Code Security dashboard is only available if you have subscribed to Application Security on Prisma Cloud. To know more on user role permissions see [Prisma Cloud Administrator Permissions](/content-collections/administration/prisma-cloud-admin-permissions.md).
The Code Security dashboard is available to users with the System Administrator role on all stacks, with the exception of [app.gov](http://app.gov) and [app.cn.](http://app.cn)
## Errors by Severity
The **Total Errors** bar provides a summary of code errors across severity of Critical, High, Medium, Low and Info. You can see custom results for all Code Security errors using filters that allow you to narrow your investigation to a specific **Repository, Code Category** or **Severity** . You can select multiple repositories, code categories and severity at once to narrow your investigation to find critical errors that may need immediate remediation . Filtering the data updates all visualizations on the dashboard. The reset filters allow you to revert back to default filter settings. You can also see contextual results for code errors by severity when selecting the number corresponding to the severity giving you access to the results from Prisma Cloud switcher Application Security **Projects > Overview**. On **Projects** you can execute remedial actions if necessary.
## Code Errors Visualization
The code errors are actionable and are grouped in these areas:
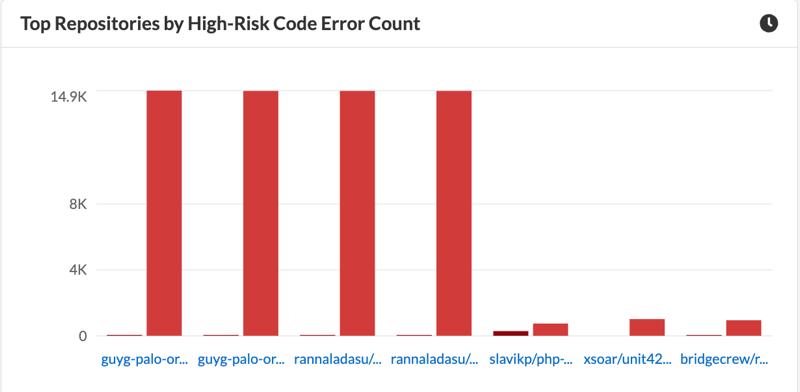
* **High-risk code errors by severity**: The **Top Repositories buy High Risk Code Error Count** provides a bar graph visualization of the top trending repositories to have a maximum number of Critical or High severity errors. The representing data is periodically updated, and you can verify the accuracy of the last scan by hovering on the timestamp.
* **Historical data for code issues and pull requests**: View the trend for code errors and pull requests for repositories that are scanned using Prisma Cloud.
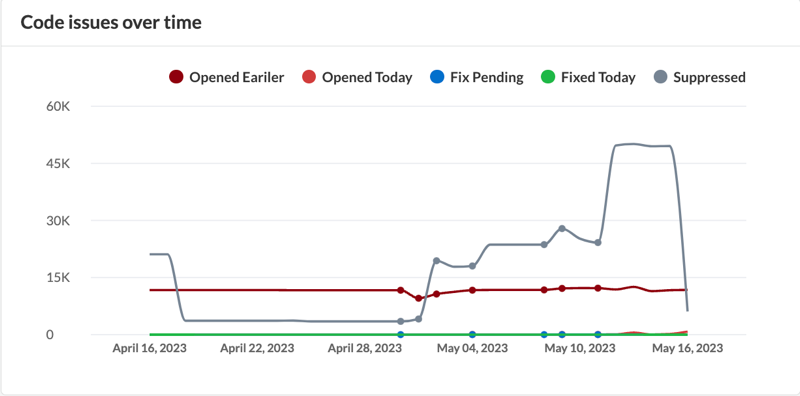
* **Code Issues over time**: Visualizes the trendline of code errors from the last 30 days of a default branch in an integrated repository . The data also gives you an understanding of when the errors occurred by monitoring data on **Opened Earlier**, **Fix Pending**, and **Suppressed**. You can also see if any remedial actions were taken on the same day by monitoring data on **Fixed Today** and **Opened Today**.
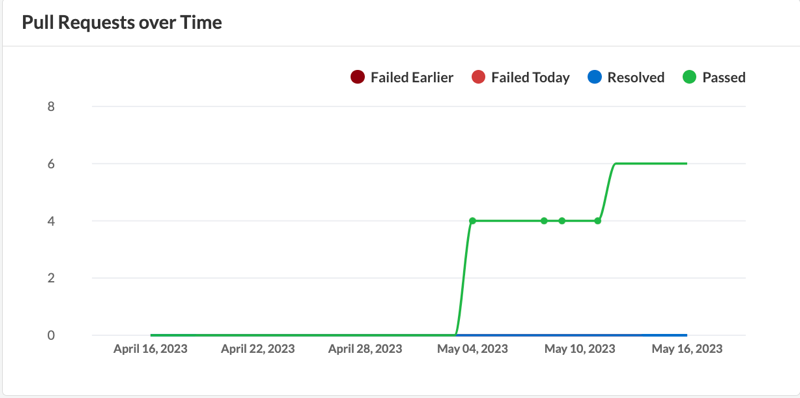
* **Pull Requests over time**: Visualizes a trendline of pull requests created on specific branches of integrated repositories from the last 30 days. Monitor the vulnerability status of the PR across **Failed Earlier**, **Failed Today**, **Resolved** and **Passed**.
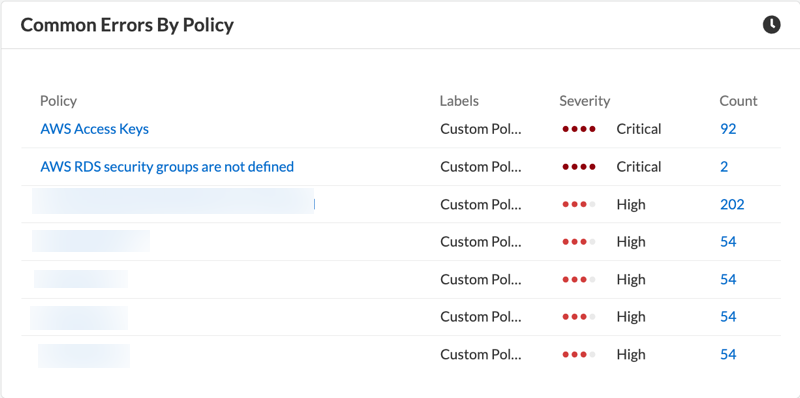
* **Common policy errors**: The **Common Errors by Policy** provides a view of policies that have the highest error count. The data contextualized here is after periodic scans with timestamp available for you to see. With the high count of errors within a policy, you can also have information of the type of policy by **Labels**, and the **Severity**. Selecting the policy directs you to **Policies** for more actionable information. While selecting the error count directs you to **Application Security > Projects > Overview** to execute a remedial action if necessary.
* **Licensing errors in non-compliant packages**: The **Top Non-compliant Package licenses** provides insight into non-compliant package licenses that are being used in the repositories. The data shows the number of repositories that are potentially exposed due to usage of non-compliant package licenses. The count shows the total number of instances the non-compliant package is used. Selecting the count directs you to **Application Security > Projects > Overview** with the non-compliant package already filtered. You can choose to execute a manual remedial action on **Overview** if necessary.
* **IaC errors in code categories**: The IaC Errors by Category provides a summarized view for misconfigurations seen in IaC category. The count in each category is the number of misconfigurations identified and on selecting the count directs you to **Application Security > Projects > IaC Misconfiguration** where you can choose to execute a remedial action on **Resource Explorer**.
* **Vulnerabilities seen in CVE from CVSS score**: The **Top CVSS Score Code Vulnerabilities** lists the highest CVSS score identified across vulnerability scans. You also see the Risk Factors, the potentially compromised CVE with **Severity**, and **Count**. Selecting the count directs you to **Application Security > Projects > Vulnerabilities** with the CVE errors preselected.
---
# Agent Instructions
This documentation is published with GitBook. GitBook is the documentation platform designed so that both humans and AI agents can read, navigate, and reason over technical content effectively. Learn more at gitbook.com.
## Querying This Documentation
If you need additional information that is not directly available in this page, you can query the documentation by asking a question.
Perform an HTTP GET request on the following URL with the `ask` and `goal` query parameters:
```
GET https://docs.prismacloud.io/content-collections/dashboards/dashboards-application-security.md?ask=&goal=
```
`ask` is the immediate question: it should be specific, self-contained, and written in natural language.
`goal` is what the user is ultimately trying to achieve, the reason they need the answer. Sharing it helps GitBook give you a better, more relevant answer. A goal is most helpful when it describes the outcome the user wants rather than restating the question. For example, with `ask=how do I create an API token`, a goal like `automate deployments from our CI pipeline` lets GitBook tailor the answer to that use case.
The response will contain a direct answer to the question and relevant excerpts and sources from the documentation.
Use this mechanism when the answer is not explicitly present in the current page, you need clarification or additional context, or you want to retrieve related documentation sections.