> For the complete documentation index, see [llms.txt](https://docs.prismacloud.io/llms.txt). Markdown versions of documentation pages are available by appending `.md` to page URLs; this page is available as [Markdown](https://docs.prismacloud.io/content-collections/dashboards/dashboards-code-to-cloud.md).
# Code to Cloud Dashboard
Get a continulously updated snapshot view into the security posture of your cloud environment, streamline tracking and reporting, and eliminate the need to create multiple saved views in various products, with Prisma Cloud’s **Code to Cloud™** dashboard. Quickly get answers to questions such as:
* What assets do I have in the cloud?
* What is my organization’s security risk posture?
* How do I track progress in securing our cloud infrastructure by application, team, and business unit?
* How can I evaluate my DevOps teams' progress in achieving our key security objectives?
The Code to Cloud Dashboard provides you with metrics and data around these key questions, helping you quantify and showcase your progress with your entire security team. Use Prisma Cloud’s out of the box Code to Cloud dashboard to track your operational progress across every phase of your application development lifecycle across Code, Build, Deploy and Run.
The Code to Cloud dashboard is available to users with the System Administrator role on all stacks, with the exception of [app.gov](http://app.gov) and [app.cn.](http://app.cn)
**Prerequisites**
To view the Code to Cloud Dashboard, complete the following tasks:
* Onboard your Cloud Accounts
* Create an alert rule with Incident and Attack Path Policies to detect issues
* Enable Applications Security specifically Infrastructure as Code (IaC) scanning
* Enable Agent-based or Agentless security for cloud workload scanning
## Latest Events Tracker
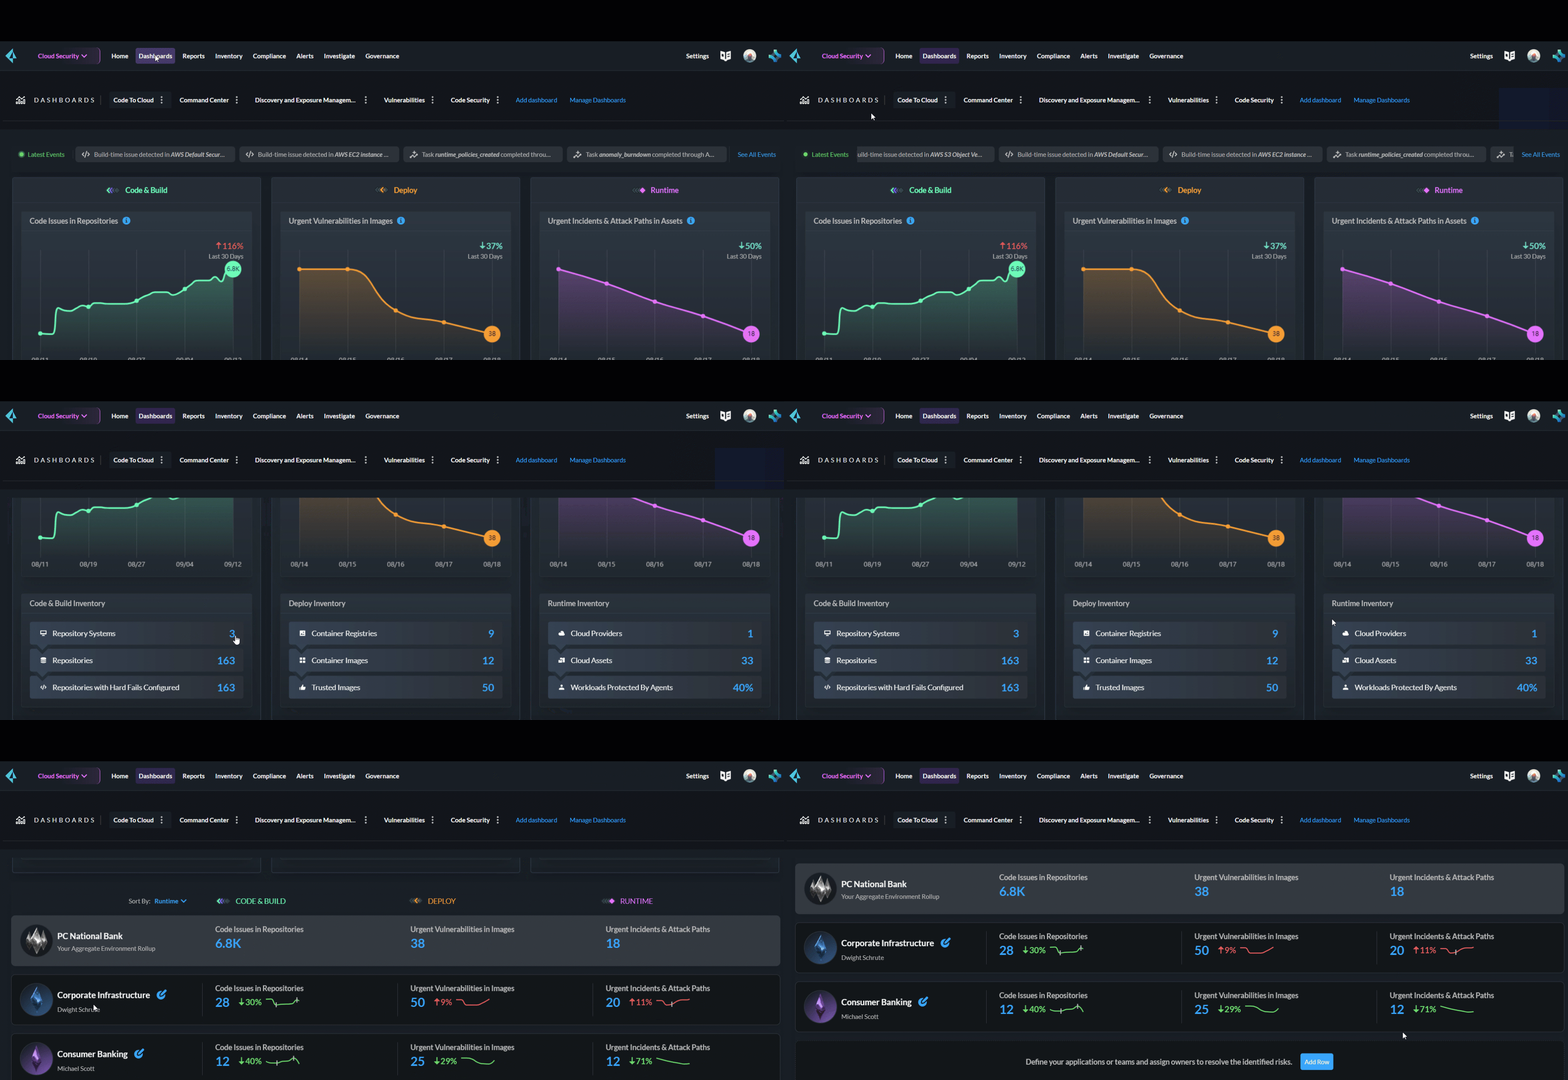
The **Dashboards > Code to Cloud > Latest Events Tracker** provides a stream of updates tracking changes across key metrics such as, Threats Detected, Alerts Remediated, Critical Alerts etc., to help you assess the strength of your security posture in real time.
Use the Latest Events live stream to quickly assess the potential threat activity taking place in your cloud environment. You can also double-click on any event to investigate critical vulnerabilities and build-time issues detected. Select **See All Events** to see a list of the latest security events across your cloud estate. Select any event to navigate to the specific alert and investigate further.
## Cloud Inventory and Graph
Code to Cloud Inventory provides a panoramic view of your entire cloud estate, helping you understand how well your organization is embracing security best practices across your cloud environment, from individual resources to the entire code pipeline.
* Graph data is sourced from Incidents, Attack Paths, Vulnerability Explorer data and IaC scans. Percentages are calculated by taking the latest snapshot and comparing it against data for the last 30 days, to derive the percentage difference.
* Metrics do not include data from non-onboarded accounts. Cloud accounts must be fully onboarded on the platform to view metrics.
### Code/Build Inventory
The Code/Build Inventory widget surfaces metrics derived from the monitoring and scanning of hundreds of code repositories across the three repository systems secured by Prisma Cloud scanners including IaC/SCA, and Secrets. Historical developer data for code issues and pull requests are also surfaced.
The **Code Issues in Repositories** graph captures code errors in the default branch of all onboarded repositories over the last thirty days. Use this graph to track your team’s progress in resolving code errors before they effect your production systems.
**Code and Build Inventory** provides you with a quick rundown of your protected repositories. Select any metric such as **Repositories Systems** to see a full catalog of all the [Code & Build Providers](https://github.com/PaloAltoNetworks/pc-docs-md/tree/main/enterprise-edition/visibility/repositories.md) with flags for Code Issues.
### Deploy Inventory
The Deploy Inventory graph visualizes the critical and high severity alerts trigerred by vulnerabilities detected in container images and registries in the last 30 days. Here you can monitor trends in the rate of vulnerabilities identified across your workloads.
Select any metric in the Deploy Inventory table to further investigate the following:
* Container Registries: View all the registries that currently scanned for vulnerabilities
* Container Images: View details on container images with detected vulnerabilities
* Trusted Images: View all the running images in your environment and their trust status
### Runtime Inventory
Runtime Inventory helps you quantify and demonstrate your progress in securing your workloads. The Runtime graph captures the top critical and high severity incidents and alerts trigerred by attack path policies in the last 30 days. Review the trendline to track your team’s progress in the remediation and the burn down of urgent incidents.
Select any metric on the Runtime Inventory table to view the total number of [cloud providers and assets](https://github.com/PaloAltoNetworks/pc-docs-md/tree/main/enterprise-edition/content-collections/cloud-and-software-inventory/cloud-and-software-inventory.md), and workloads protected by agents. For isntance, you can select the Workloads Protected by Agents metric to view potentially compromised workloads that maybe infected with malware.
The Inventory data above is sourced from Prisma Cloud Incidents, Attack Paths, Vulnerability Explorer, and IaC scanning data. Percentages are calculated by tabulating the difference between the latest snapshot and data points for the last 30 days.
## Top Issues by Collection
The Code to Cloud dashboard, also provides you with the option to define your applications or teams and assign owners to track and monitor progress. You can compare key metrics such as **Code Issues in Repositories** or **Urgent Vulnerabilities in Images** across teams, business units and applications to benchmark security standards.
The first row of the table captures the aggregate of all issues across all tenants in your onboarded accounts. Use the **Sort By** drop-down to catgorize your business unit view across Code/Build, Deploy and Run phases of the application lifecycle.
**Add Row** also allows you to create your own [custom collection](/content-collections/administration/collections.md) of accounts, application owners or business units to obtain more granular results on risks by individual applications and stakeholders.
The following caveats apply to Collections:
* Only System Administrators can create or add Collections.
* The Code to Cloud Row trendline is initiated after at least one row is added. Trendline data is populated only after regularly scheduled Prisma Cloud system updates. Trendlines may display a no data available message prior to system update.
* You can add Repositories to Collections. If a Repository is deleted at the source, it may still appear in a Collection.
---
# Agent Instructions
This documentation is published with GitBook. GitBook is the documentation platform designed so that both humans and AI agents can read, navigate, and reason over technical content effectively. Learn more at gitbook.com.
## Querying This Documentation
If you need additional information that is not directly available in this page, you can query the documentation by asking a question.
Perform an HTTP GET request on the following URL with the `ask` and `goal` query parameters:
```
GET https://docs.prismacloud.io/content-collections/dashboards/dashboards-code-to-cloud.md?ask=&goal=
```
`ask` is the immediate question: it should be specific, self-contained, and written in natural language.
`goal` is what the user is ultimately trying to achieve, the reason they need the answer. Sharing it helps GitBook give you a better, more relevant answer. A goal is most helpful when it describes the outcome the user wants rather than restating the question. For example, with `ask=how do I create an API token`, a goal like `automate deployments from our CI pipeline` lets GitBook tailor the answer to that use case.
The response will contain a direct answer to the question and relevant excerpts and sources from the documentation.
Use this mechanism when the answer is not explicitly present in the current page, you need clarification or additional context, or you want to retrieve related documentation sections.