> For the complete documentation index, see [llms.txt](https://docs.prismacloud.io/llms.txt). Markdown versions of documentation pages are available by appending `.md` to page URLs; this page is available as [Markdown](https://docs.prismacloud.io/content-collections/dashboards/dashboards-command-center.md).
# Command Center Dashboard
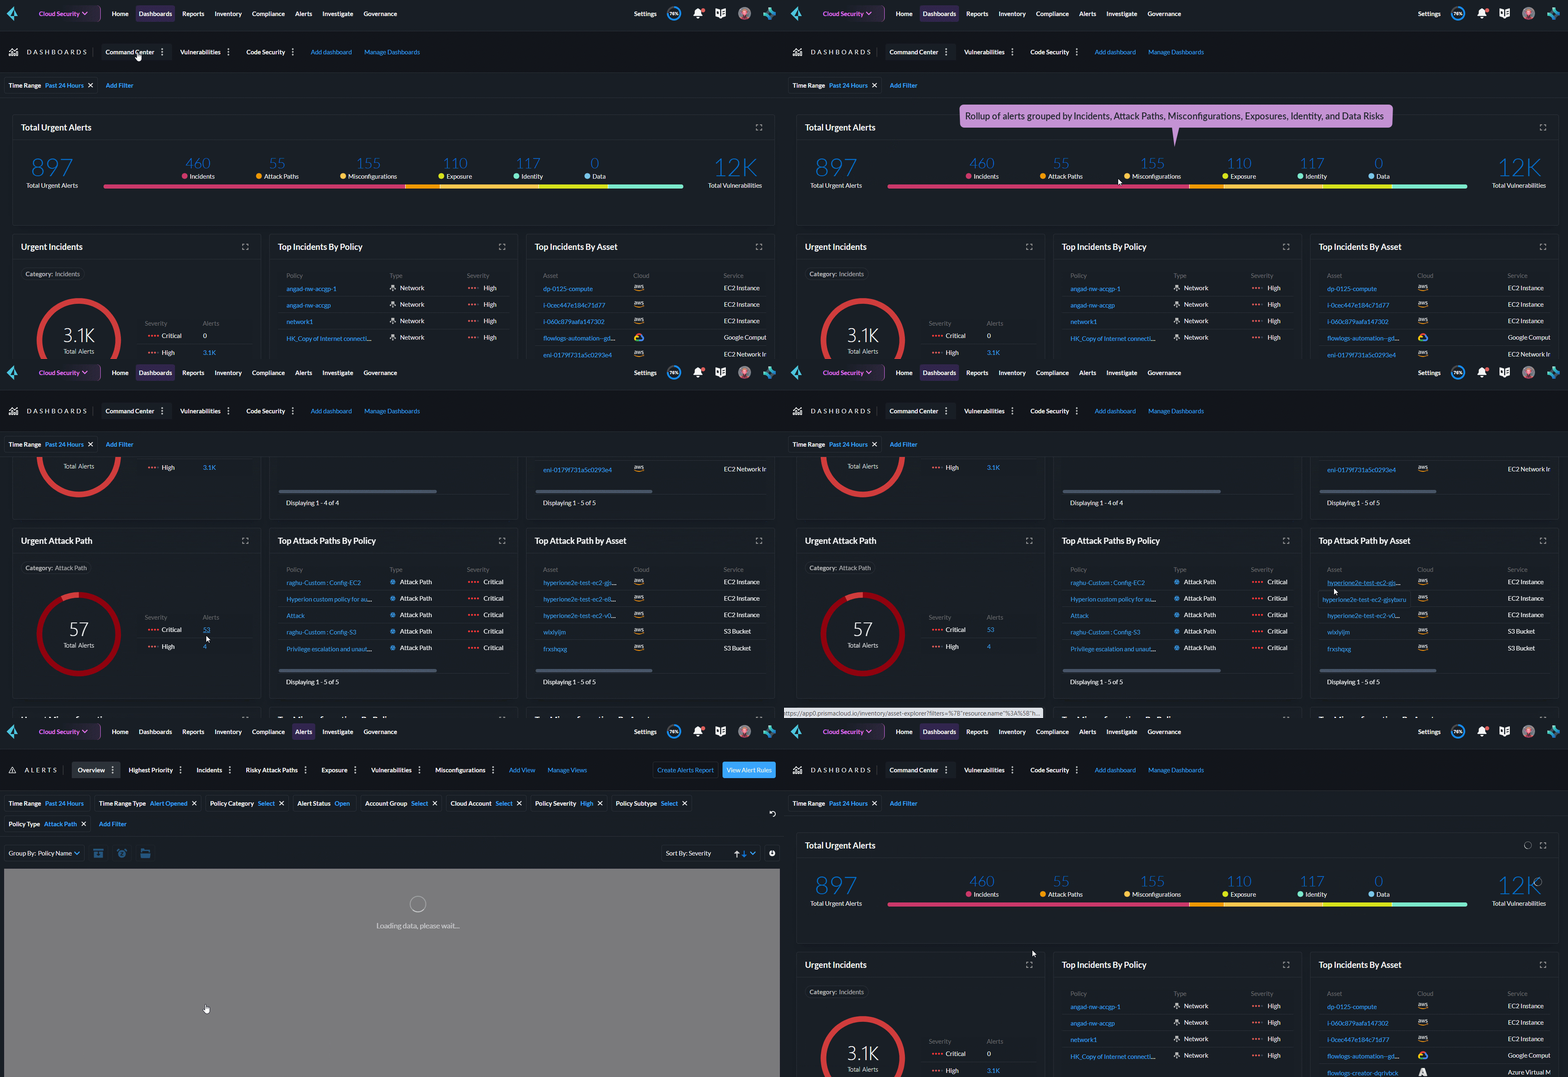
The Command Center dashboard provides you with a centralized view of the top cloud security incidents and risks uncovered across the assets monitored by Prisma® Cloud. It provides you with an at a glance picture of the highest priority incidents and risks that require attention across the following attack vectors:
* Urgent Incidents
* Urgent Attack Path
* Urgent Misconfigurations
* Urgent Vulnerabilities
* Urgent Exposures
* Urgent Identity Risks
* Urgent Data Risks
Navigate to **Dashboards > Command Center** to view and manage the dashboard. The Command Center dashboard is only available to users with a System Admin role. Users with a business license cannot view the dashboard.
## Total Urgent Alerts
The **Total Urgent Alerts** bar provides a tally of alerts grouped by Incidents, Attack Paths, Misconfigurations, Exposures, Identity, and Data Risks. Use the **Filter** controls to narrow your investigation to a specific **Time Range** or **Account Group**. Select multiple account groups to view data from multiple account sources. Filter data is updated across all the alert visualizations on the dashboard. Select the revert icon to restore previous default filter settings. The image below outlines the key features of the Command Center dashboard.
## Alerts Visualization
Actionable alert data is further grouped into the following areas by risk type:
| **Urgent Incidents** | Retrieves data for alerts generated by Anomalies, Network and Workload Incidents and Audit Events. |
| ---------------------------- | --------------------------------------------------------------------------------------------------------------------------------------------------------------------------------------------------------------------------------------------------------------------------------------------------------------------------- |
| **Urgent Attack Paths** | Highlights assets with critical and urgent exposures that bear the signature of an imminent attack. |
| **Urgent Misconfigurations** | Captures data for alerts generated by policies with configuration errors. |
| **Urgent Vulnerabilities** | Provides insight into potentially compromised assets in your cloud environment, capturing the top five assets with vulnerabilities that triggered the most number of Critical and High alerts. Select any listed image or asset to access the Assets Explorer to investigate further and take remedial action if necessary. |
| **Urgent Exposures** | Retrieves data for alerts generated by violations in network policies in addition to the policy subtype config. |
| **Urgent Identity Risks** | Lists alerts generated by violations in Identity and Access Management policies. This view is only available by subscription. |
| **Urgent Data Risks**: | Retrieves data for alerts generated by exceptions in the policy type Data. This view is only enabled by subscription. Confirm with PM status of Data Risks. |
## Alerts Actions
Each alerts visualization allows you to further drill down and view the source of the alert by the policy name or the asset it originated from:
The Urgent Incidents widget above for instance, provides three visualizations of urgent alert activity:
* **Urgent Incidents**: Provides a doughnut chart visualization of Critical and High severity Incidents. Select any alert for an in depth look at anomalies, network and workload incidents and audit events.
* **Top Incidents by Policy**: Lists the top five policies that triggered an alert. Select a policy or an alert total for a detailed view of policy coverage incidents. You can also [investigate alerts](/content-collections/alerts/view-respond-to-prisma-cloud-alerts.md) within individual policies.
* **Top Incidents by Asset**: Lists top five incidents by asset name, number of alerts, service, and account name. Learn more about [responding to alerts](/content-collections/cloud-and-software-inventory/asset-inventory.md) generated in a specific asset.
## Generate Reports
You can also share Command Center reports with stakeholders to keep them abreast of the security and compliance status of your cloud assets. Select the **Generate Report** button to create and download a report. This generates the **Top Cloud Risks and Incidents Report** for that specific time range and selected account group(s).
The generated report captures the top alerts listed under each widget and also includes an **Executive Summary** as shown above, capturing the top urgent incidents across your organizations’ cloud assets.
---
# Agent Instructions
This documentation is published with GitBook. GitBook is the documentation platform designed so that both humans and AI agents can read, navigate, and reason over technical content effectively. Learn more at gitbook.com.
## Querying This Documentation
If you need additional information that is not directly available in this page, you can query the documentation by asking a question.
Perform an HTTP GET request on the following URL with the `ask` and `goal` query parameters:
```
GET https://docs.prismacloud.io/content-collections/dashboards/dashboards-command-center.md?ask=&goal=
```
`ask` is the immediate question: it should be specific, self-contained, and written in natural language.
`goal` is what the user is ultimately trying to achieve, the reason they need the answer. Sharing it helps GitBook give you a better, more relevant answer. A goal is most helpful when it describes the outcome the user wants rather than restating the question. For example, with `ask=how do I create an API token`, a goal like `automate deployments from our CI pipeline` lets GitBook tailor the answer to that use case.
The response will contain a direct answer to the question and relevant excerpts and sources from the documentation.
Use this mechanism when the answer is not explicitly present in the current page, you need clarification or additional context, or you want to retrieve related documentation sections.