> For the complete documentation index, see [llms.txt](https://docs.prismacloud.io/llms.txt). Markdown versions of documentation pages are available by appending `.md` to page URLs; this page is available as [Markdown](https://docs.prismacloud.io/content-collections/dashboards/dashboards-compliance.md).
# Compliance Dashboard
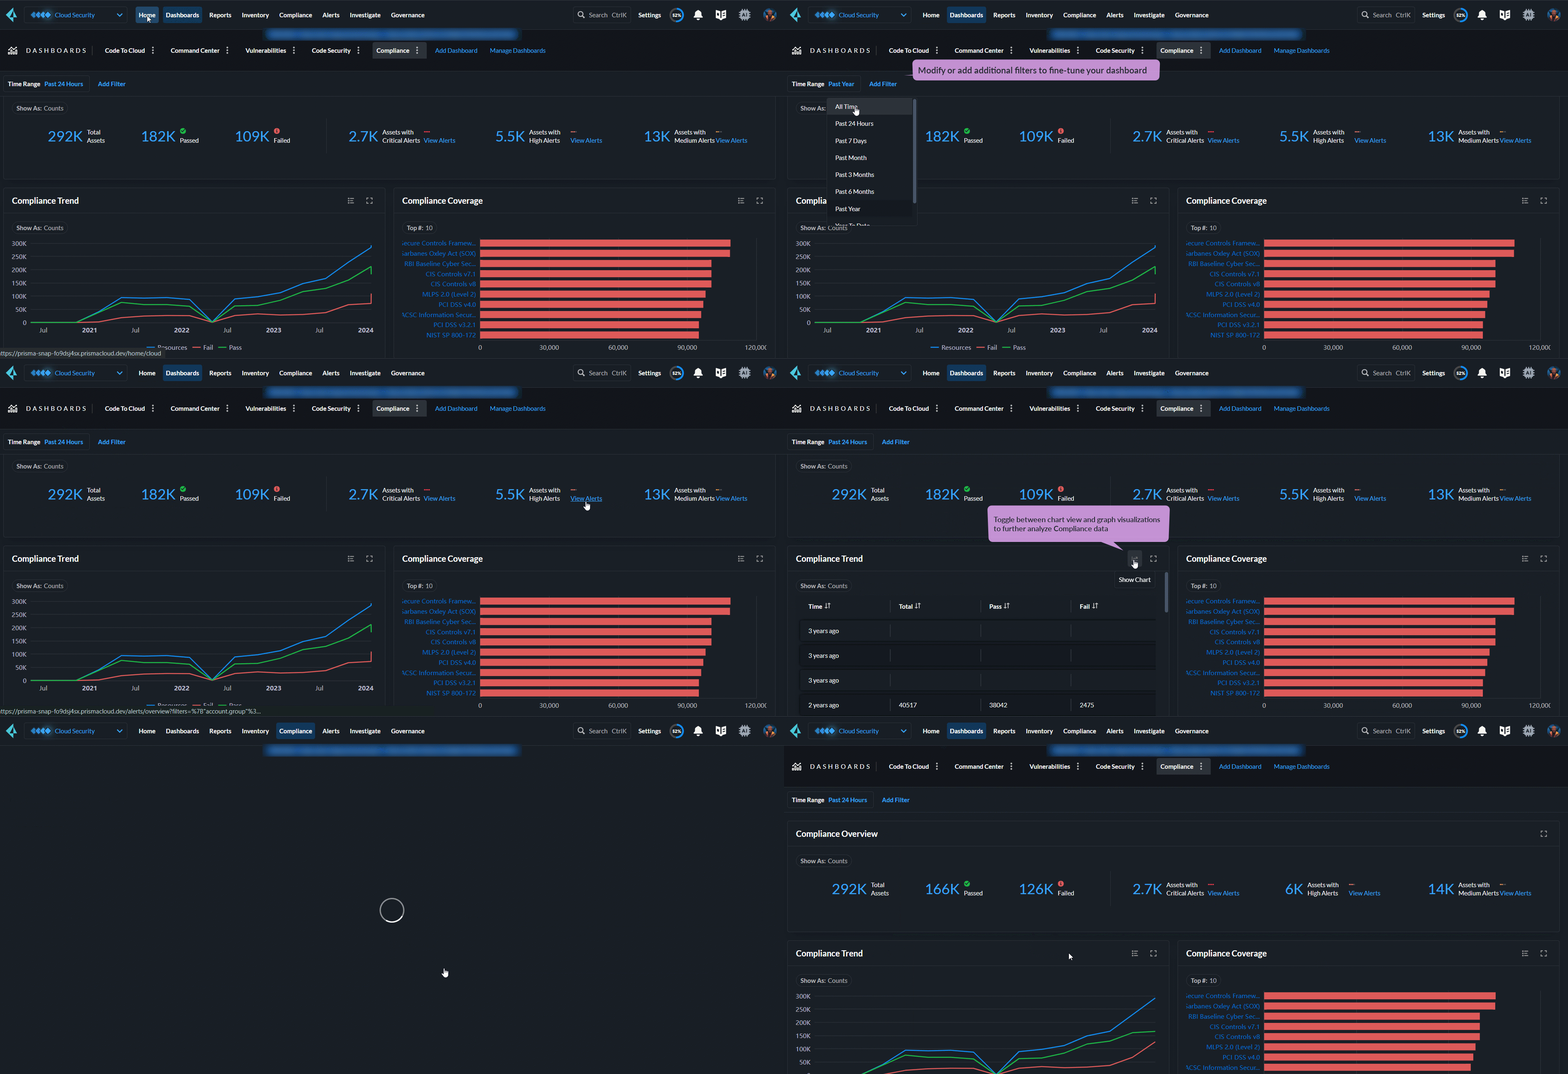
Prisma Cloud’s **Compliance** dashboard provides a snapshot view of your overall compliance posture across multiple compliance standards. The dashboard provides you with an interactive look at how your compliance coverage maps to the established compliance frameworks available within Prisma Cloud.
Use the Compliance dashboard as a tool for risk oversight across all the supported cloud platforms and quickly evaluate your compliance posture using real-time data. Use the provided **Filters** to hone in on the time period, cloud account, or account group you would like to focus on. By default, the dashboard shows your compliance state for the last 24 hour period. The Compliance dashboard is available to users with the System Administrator role on all stacks, with the exception of [app.gov](http://app.gov) and [app.cn.](http://app.cn)
The service level agreement (SLA) for compliance dashboard refresh is **within 24 hours**. In many cases, refreshes may occur sooner, however the actual timing can vary based on various factors such as, resource change frequency.
Asset totals reported on the Compliance Dashboard and Asset Inventory are the sum of all assets with violations and not the total number of alerts generated by that asset. The Assets page therefore may have a different total than the tally found on the Compliance dashboard and should not be compared.
## Compliance Overview
The compliance score presents data on the total unique resources that are passing or failing the policy checks that match compliance standards. Use this score to audit how many unique resources are failing compliance checks and get a quick count on the severity of these failures. The links allow you to view the list of all resources on the **Inventory** page, and the **View Alerts** link enables you to view all the open alerts of Low, Medium, or High severity.
## Compliance Trend
The compliance trendline is a line chart that shows you how the compliance posture of your monitored resources have changed over time (on the horizontal X axis). You can view the total number of resources monitored (in blue), and the number of resources that passed (in green) and failed (in red) over that time period.
## Compliance Coverage
The Compliance coverage bar graph highlights the passed and failed resource count across all compliance standards for easy comparison. Selct any given compliance standard to view the total number of failed assets for that standard. Click on the compliance standard to view policy details.
---
# Agent Instructions
This documentation is published with GitBook. GitBook is the documentation platform designed so that both humans and AI agents can read, navigate, and reason over technical content effectively. Learn more at gitbook.com.
## Querying This Documentation
If you need additional information that is not directly available in this page, you can query the documentation by asking a question.
Perform an HTTP GET request on the following URL with the `ask` and `goal` query parameters:
```
GET https://docs.prismacloud.io/content-collections/dashboards/dashboards-compliance.md?ask=&goal=
```
`ask` is the immediate question: it should be specific, self-contained, and written in natural language.
`goal` is what the user is ultimately trying to achieve, the reason they need the answer. Sharing it helps GitBook give you a better, more relevant answer. A goal is most helpful when it describes the outcome the user wants rather than restating the question. For example, with `ask=how do I create an API token`, a goal like `automate deployments from our CI pipeline` lets GitBook tailor the answer to that use case.
The response will contain a direct answer to the question and relevant excerpts and sources from the documentation.
Use this mechanism when the answer is not explicitly present in the current page, you need clarification or additional context, or you want to retrieve related documentation sections.