> For the complete documentation index, see [llms.txt](https://docs.prismacloud.io/llms.txt). Markdown versions of documentation pages are available by appending `.md` to page URLs; this page is available as [Markdown](https://docs.prismacloud.io/content-collections/governance/manage-prisma-cloud-policies.md).
# Manage Prisma Cloud Policies
Learn how to select Prisma Cloud policies.
Prisma Cloud policies enable you to monitor and manage potential misconfiguration or risks across your cloud infrastructure. You can use the graphs and tables on **Policies** to assess your policy coverage and utilization of policies.
To help you find the relevant policies based on your role, you can interact with the table data or add filters such as Policy Category, Class, Type, and Subtype and use **Group By** to aggregate policies using criteria that is important to you.
You can visualize how many policies are enabled as a number, review the split across different policy types, how many policies of different severities are identified in your infrastructure, and gain greater context on the policy category and Prisma Cloud versus custom policies that are generating alerts.
Policies are in the *categories* of incidents and risks. An incident is likely a policy that identifies a potential security issue, while a risk is one that checks for risky configurations. The policy *type* indicates whether the check is performed against the network logs, audit logs, configuration logs, or user activity logs. Each policy type has *subtypes* for more granularity, for example, Anomaly policies are split into two subtypes—Network and UEBA. *Class* is another way to logically group policies into buckets such as Misconfiguration or Privileged Activity Monitoring.
| Category | Class | Type | Subtype |
| ------------------------------ | ---------------- | ------------------- | ------- |
| **Incident** | Behavioral | Anomaly | UEBA |
| Behavioral | Anomaly | Network | |
| Behavioral | Anomaly | DNS | |
| Privileged Activity Monitoring | Audit Event | Audit | |
| Network Protection | Network | Network Event | |
| Runtime | Workload | Run | |
| **Risk** | Misconfiguration | Config | Run |
| Misconfiguration | Config | Build | |
| Misconfiguration | Data | Data Classification | |
| Vulnerability | Data | Malware | |
| Vulnerability | Workload | Run | |
Use the following workflows to manage your Prisma Cloud policies. You can download policy data, clone, enable, delete, or disable policies from the **Policies** page.
1. Select **Application Security** on the Prisma Cloud switcher.
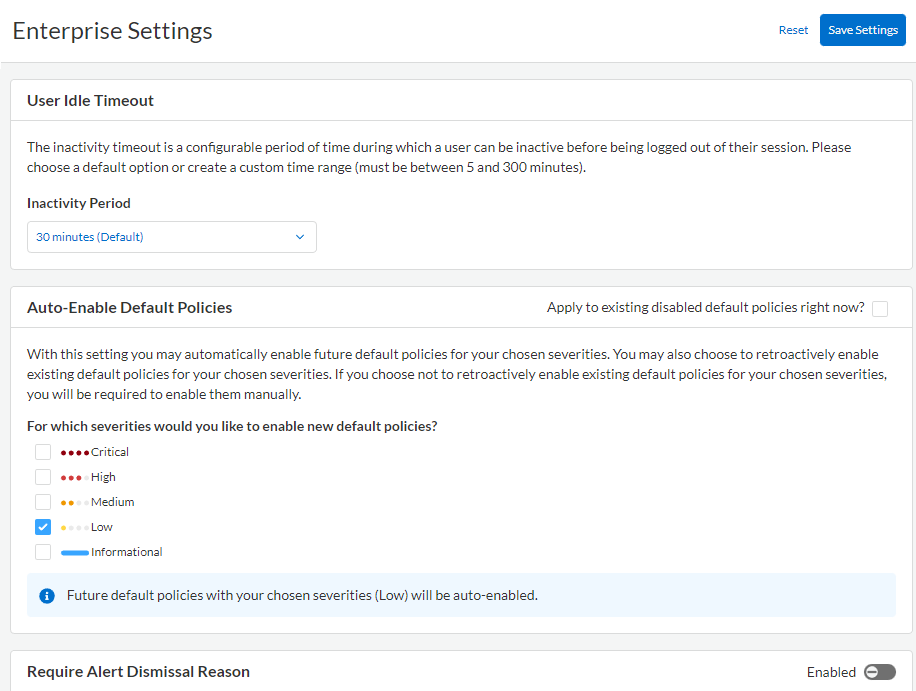
2. Select **Settings** from the top right corner and then select **Enterprise Settings**.
While some high severity policies are enabled to provide the best security outcomes, by default, policies of medium or low severity are in a disabled state
3. To enable policies based on severity, select **Auto-Enable Default Policies** of the type — Critical, High, Medium, Low or Informational. Based on what you enable, Prisma Cloud will scan your resources in the onboarded cloud accounts against policies that match the severity and generate alerts. Anomaly policies offer more customizable settings, see [Define Prisma Cloud Enterprise and Anomaly Settings](/content-collections/administration/define-prisma-cloud-enterprise-settings.md#id6f5bd95c-b5b5-48bf-b397-312f4de3e08c) .
4. When you **Save** your changes, you can choose one of the following options:
* **Enable and Save**—With Enable and Save, you are enabling all existing policies that match your selection criteria and new Prisma Cloud default policies that are periodically added to the service. This option allows you to enable and scan your resources against all existing and new policies to help you stay ahead of threats and misconfigurations.
* **Save**—With Save, you are saving your selection criteria and enabling new Prisma Cloud default policies only as they are periodically added to the service. New policies that match your selection, are automatically enabled and your resources are scanned against them after you made the change.
If you enable policies of a specific severity, when you then clear the checkbox, the policies that were enabled previously are not disabled; going forward, policies that match the severity you cleared are no longer enabled to scan your cloud resources and generate alerts.
5. The audit logs include a record of all activities performed or initiated on Prisma Cloud. To view the audit logs select **Settings > Audit Logs**.
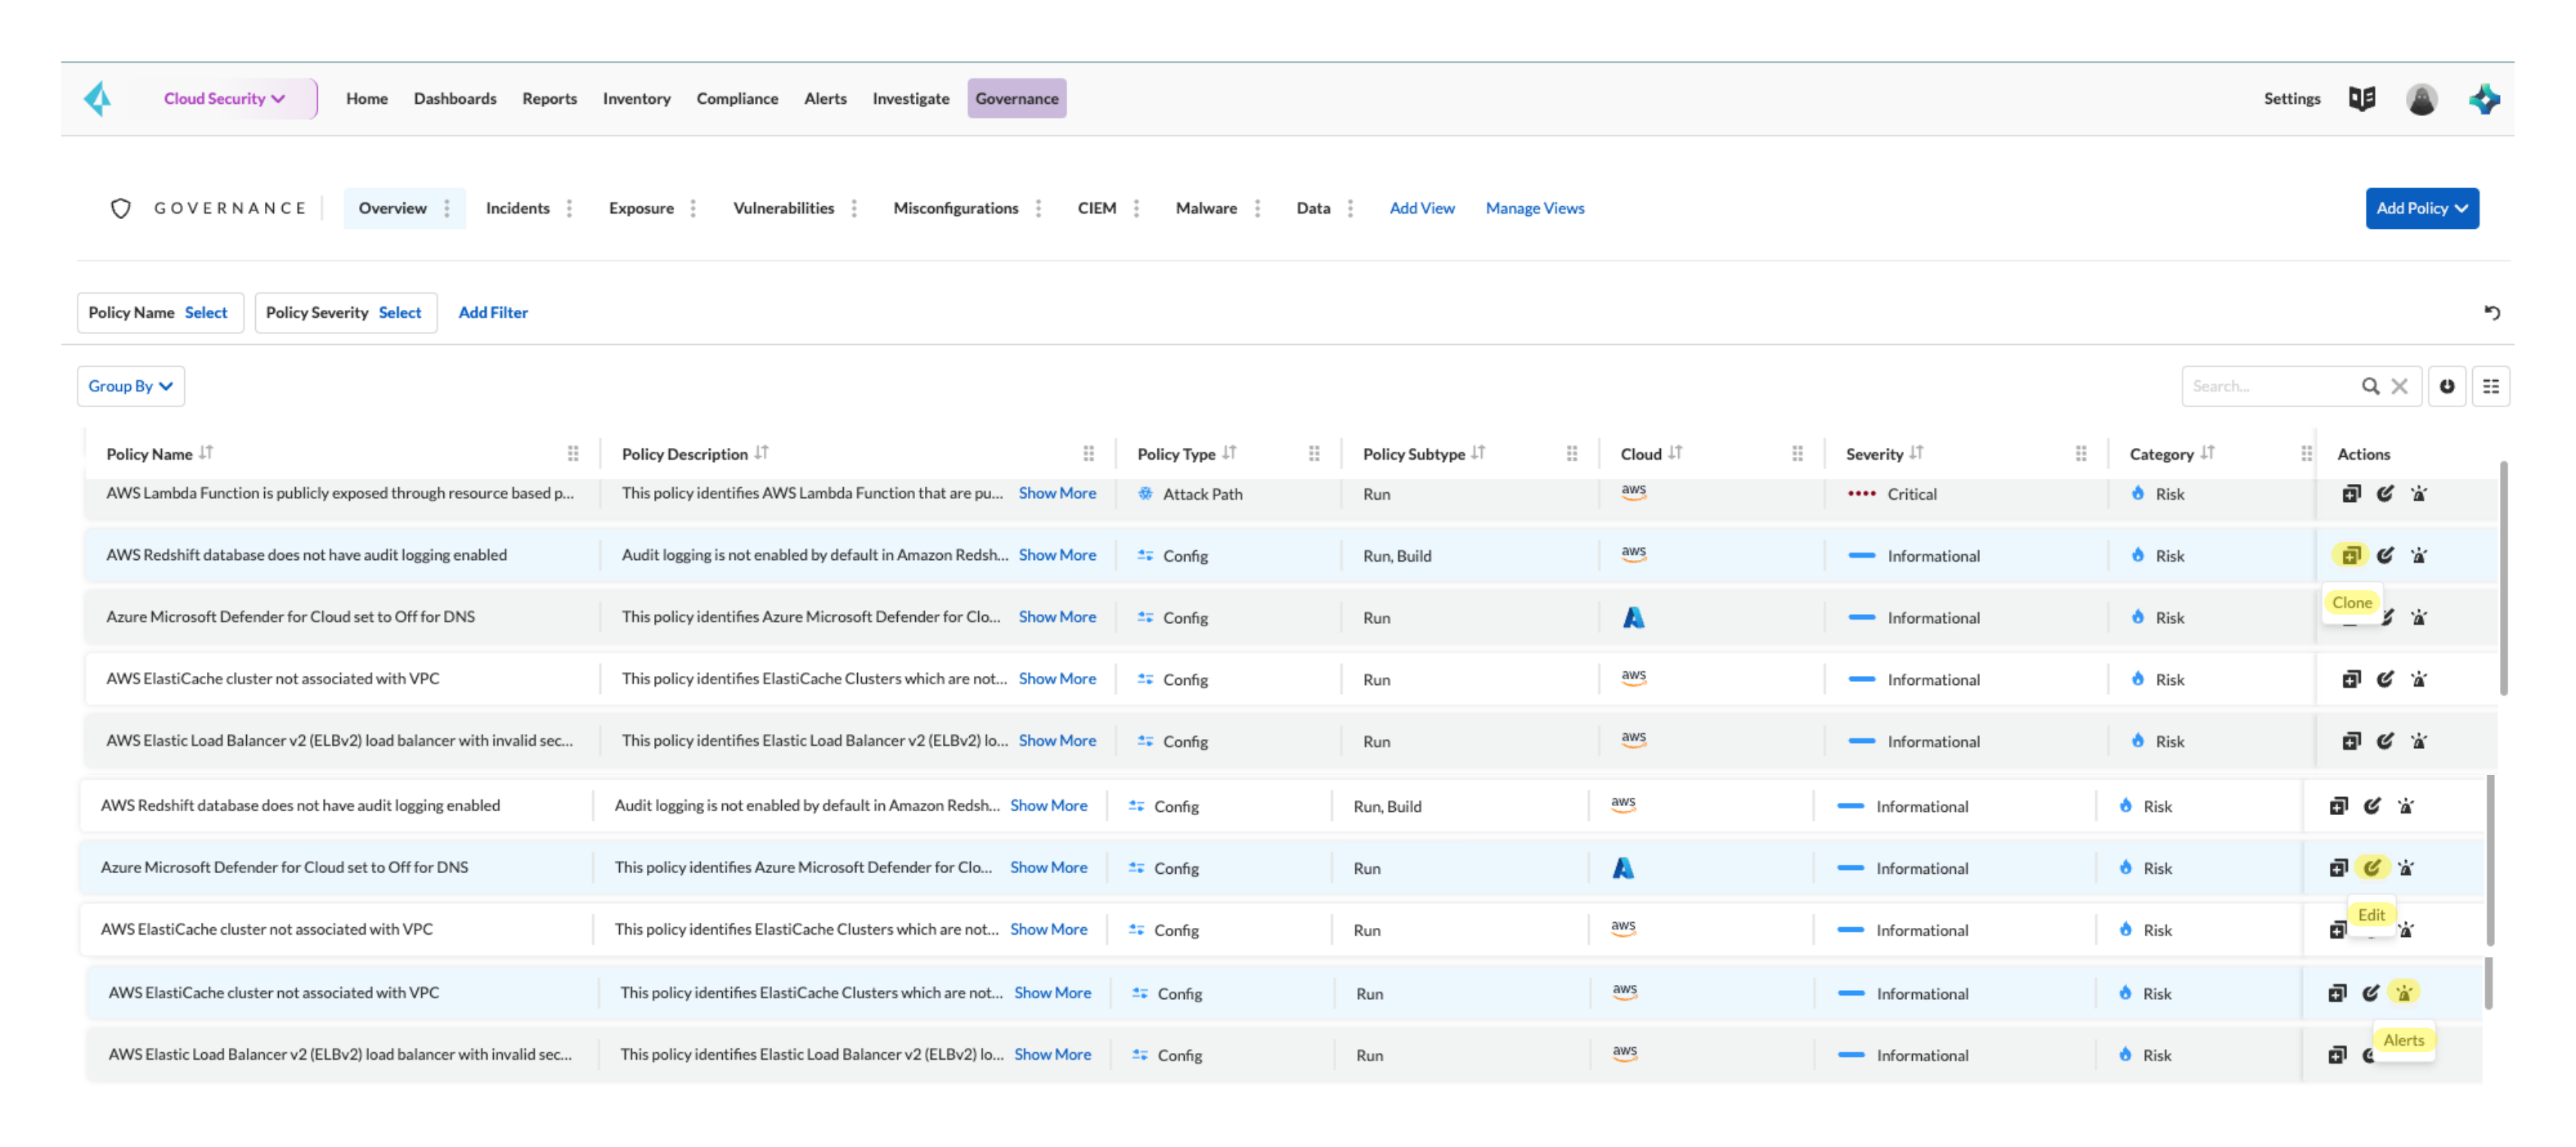
6. To view policies, go to **Governance** and select or **Manage Views**.
7. **Add Filters** and select the filtering criteria.
Filters enable you to narrow the search results on the page. The values you select within a filter use the AND operator to display results. Across different filters, the selected values work as OR operators. In the table view, you can also use the **Group By** to aggregate policies using criteria that is important to you.
tt:\[NOTE:] To find all Prisma Cloud policies of a specific **Policy Subtype**, when you select the values **Build** and **Run**, you can view all policies that are classified as Build policies OR Run policies. To find all policies that are classified as Build and Run, you must select the filter value **Build, Run**.
Filter combinations can also be saved as customizable [Saved View](https://github.com/PaloAltoNetworks/pc-docs-md/tree/main/enterprise-edition/content-collections/administration/saved-views.md). Learn more about how you can add new views and modify the existing views available to you.
8. Select **Download** at the top right corner of the table to download the details of your policies (or a filtered set of policies) in a CSV format.
9. Enable or disable any policy using the toggle in the **Status** column.
tt:\[NOTE:] Keep the following caveats in my mind when you enable/disable policies:
* When you disable a policy, a confirmation message displays to inform you that **Disabling this policy will automatically mark any open alerts as resolved. You won’t be able to enable the policy back for 4 hours. Are you sure you want to continue?**. After you confirm, the policy is disabled. During this period, the toggle to enable the policy will be greyed out and if you use the API to change the policy status the HTTP response will display an error. This applies to all policy types and policy severities.
* The enable/disable toggle is not available when using the **Group By** function to bulk enable/disable policies. Deselect fields in the **Group By** column to enable/disable policies individually.
10. Each custom policy allows three **Actions** - **Edit** a custom policy (you cannot edit a Prisma Cloud default policy), **Clone** an existing policy, and view **Alerts** associated with a policy.
To quickly create a new policy, you can clone a Prisma Cloud default policy and then modify the details.
---
# Agent Instructions
This documentation is published with GitBook. GitBook is the documentation platform designed so that both humans and AI agents can read, navigate, and reason over technical content effectively. Learn more at gitbook.com.
## Querying This Documentation
If you need additional information that is not directly available in this page, you can query the documentation by asking a question.
Perform an HTTP GET request on the following URL with the `ask` and `goal` query parameters:
```
GET https://docs.prismacloud.io/content-collections/governance/manage-prisma-cloud-policies.md?ask=&goal=
```
`ask` is the immediate question: it should be specific, self-contained, and written in natural language.
`goal` is what the user is ultimately trying to achieve, the reason they need the answer. Sharing it helps GitBook give you a better, more relevant answer. A goal is most helpful when it describes the outcome the user wants rather than restating the question. For example, with `ask=how do I create an API token`, a goal like `automate deployments from our CI pipeline` lets GitBook tailor the answer to that use case.
The response will contain a direct answer to the question and relevant excerpts and sources from the documentation.
Use this mechanism when the answer is not explicitly present in the current page, you need clarification or additional context, or you want to retrieve related documentation sections.