> For the complete documentation index, see [llms.txt](https://docs.prismacloud.io/llms.txt). Markdown versions of documentation pages are available by appending `.md` to page URLs; this page is available as [Markdown](https://docs.prismacloud.io/content-collections/runtime-security/vulnerability-management/vulnerability-management-policies.md).
# Vulnerability Management Policies
Vulnerability policies are composed of discrete rules. Rules declare the actions to take when vulnerabilities are found in the resources in your environment. They also control the data surfaced in Prisma Cloud Console, including scan reports and Radar visualizations.
Rules let you target segments of your environment and specify actions to take when vulnerabilities of a given type are found. For example,
*Block images with critical severity vulnerabilities from being deployed to prod environment hosts*
When there is no matching rule for vulnerability scanning on specific resources such as an image or a function, Prisma Cloud generates alerts on all vulnerabilities that are found.
There are separate vulnerability policies for containers, hosts, and serverless functions. Host and serverless rules offer a subset of the capabilities of container rules, the big difference being that container rules support blocking.
## Create Vulnerability Rules
Prisma Cloud ships with a simple default vulnerability policy for containers, hosts, and serverless functions. These policies have a rule named *Default - alert all components*, which sets the alert threshold to low. With this rule, all vulnerabilities in images, hosts, and functions are reported.
As you build out your policy, you’ll create rules that filter out insignificant information, such as low-severity vulnerabilities, and surface vital information, such as critical vulnerabilities.
[Rule order](/content-collections/runtime-security/configure/rule-ordering-pattern-matching.md#rule-order) is important. Prisma Cloud evaluates the rule list from top to bottom until it finds a match based on the object filters.
By default, Prisma Cloud optimizes resource usage by only scanning images with running containers. Therefore, you might not see a scan report for an image when it is first pulled into your environment unless it’s been run. Note that images for short-lived containers are not scanned. To scan all images on the hosts (except CRI-O and containerd images) in your environment, go to **Manage > System > Scan**, set **Only scan images with running containers** to **Off**, and click **Save**.
When **Only scan images with running containers** is turned off, the image details show the Start time when the Defender first reads the image. This is applicable for all images (deployed and not deployed), except CRI-O and containerd images.
To create a vulnerability rule:
1. Open Console.
2. Go to **Defend > Vulnerabilities > {Images | Hosts | Functions}**.
3. Click **Add rule**.
4. Enter a rule name and configure the rule. Configuration options are discussed in the following sections.
5. Click **Save**.
6. View the impact of your rule. Go to **Monitor > Vulnerabilities** to view the scan reports.
## Severity-based Actions
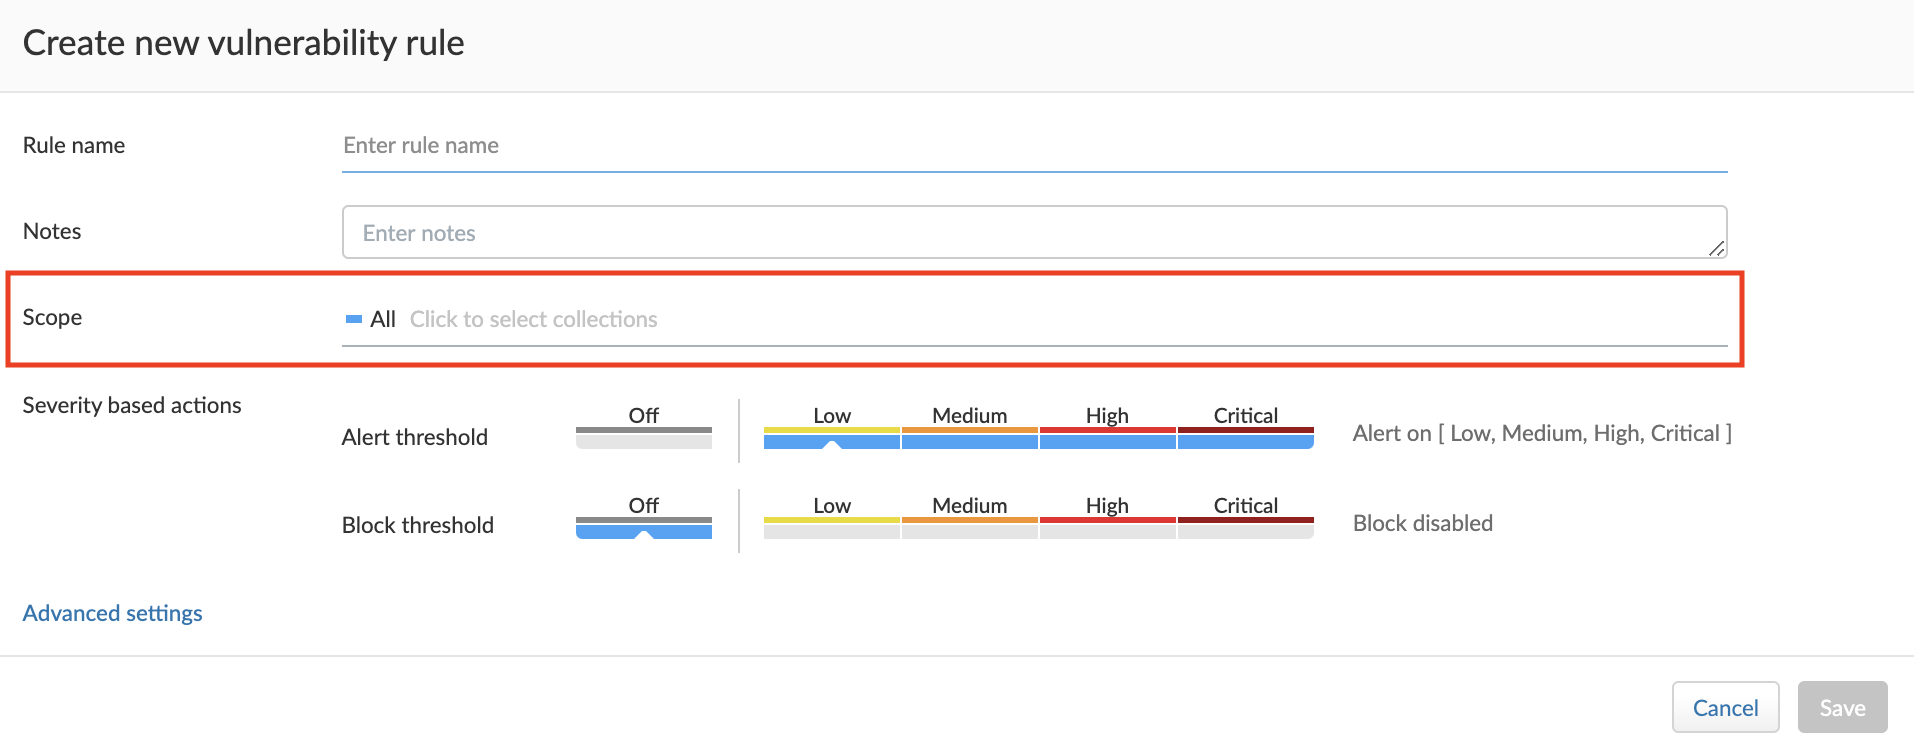
Vulnerability rules let you specify Alert/Block/Failure triggers based on severity thresholds.
The Severity-based actions let you establish quality gates in the CD segment of your continuous integration (CI) continuous deployment (CD) pipeline.
The Severity threshold can be set at different values.
Setting the alert threshold to off allows all vulnerabilities for the resources in scope (as defined by your filters). Practically, resource nodes in Radar turn green (no issues to report), and scan reports are empty (no issues to report).
When you create a [blocking rule](/content-collections/runtime-security/install/deploy-defender/defender-architecture.md#blocking-rules), Defender automatically installs itself as the final arbiter of all container lifecycle commands. This way, the Defender can assess a Docker command, your current policy, and the status of an image before either forwarding the command to runC for execution or blocking it altogether.
## Risk factors-based Actions
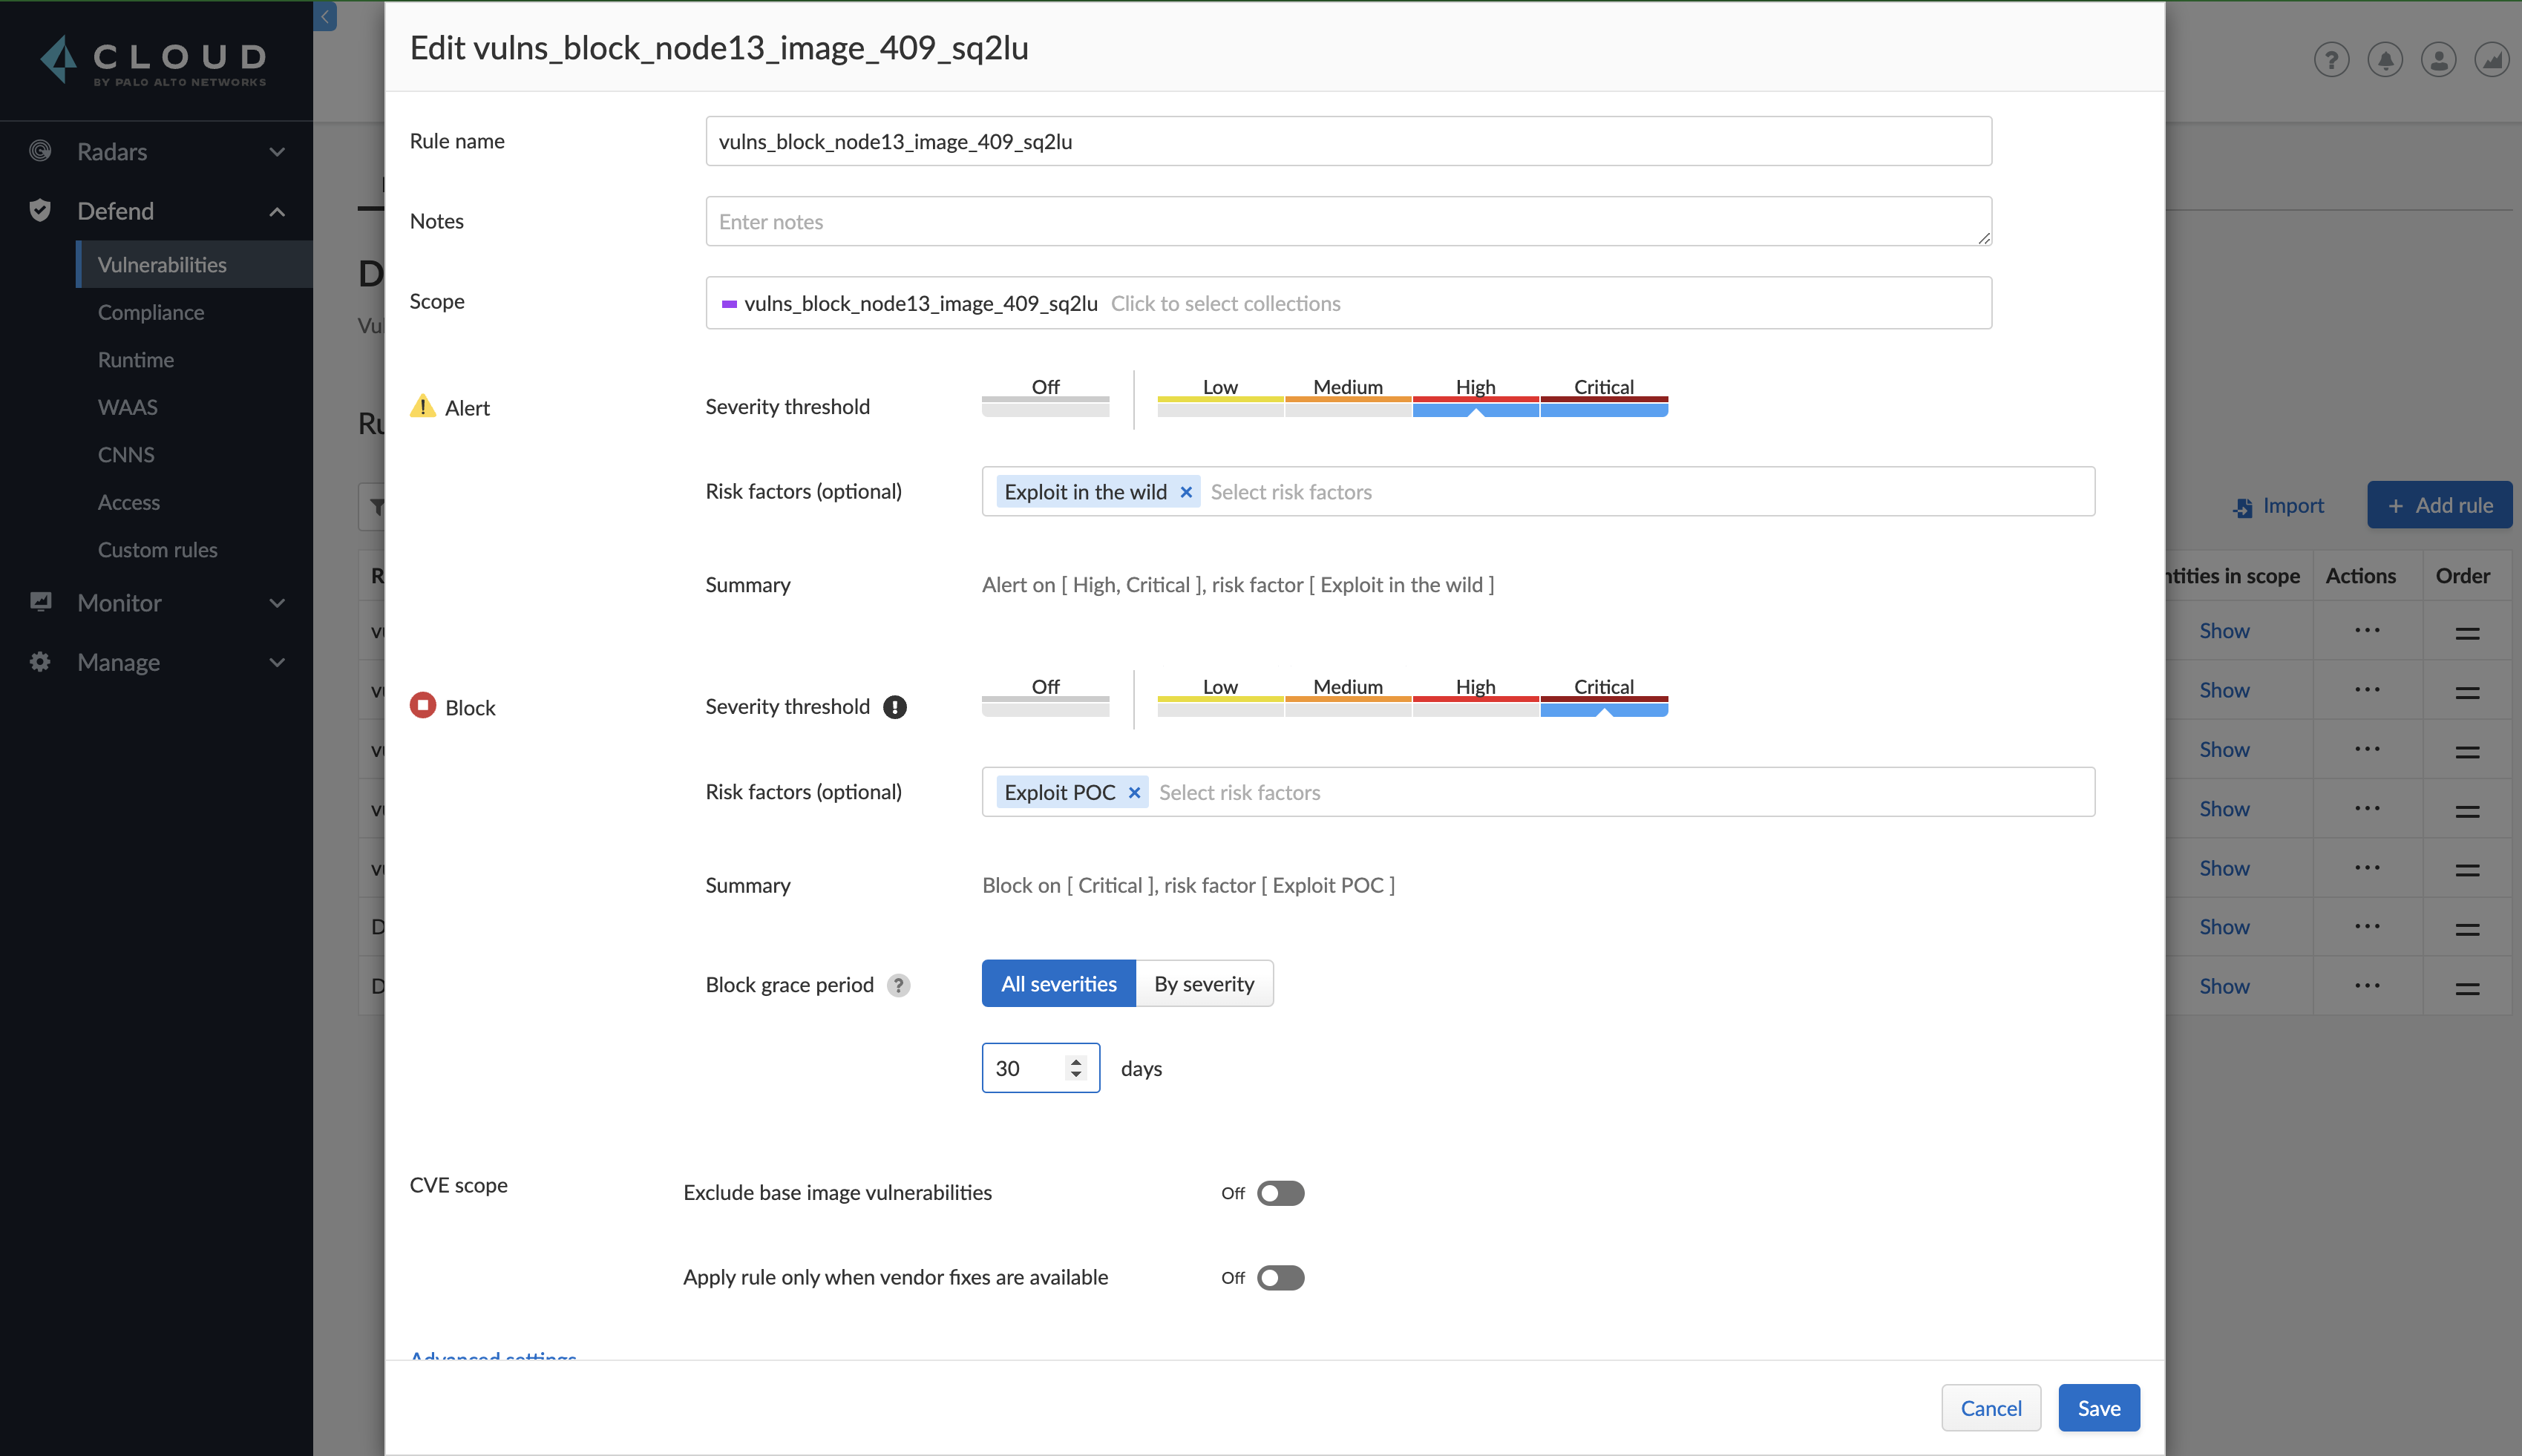
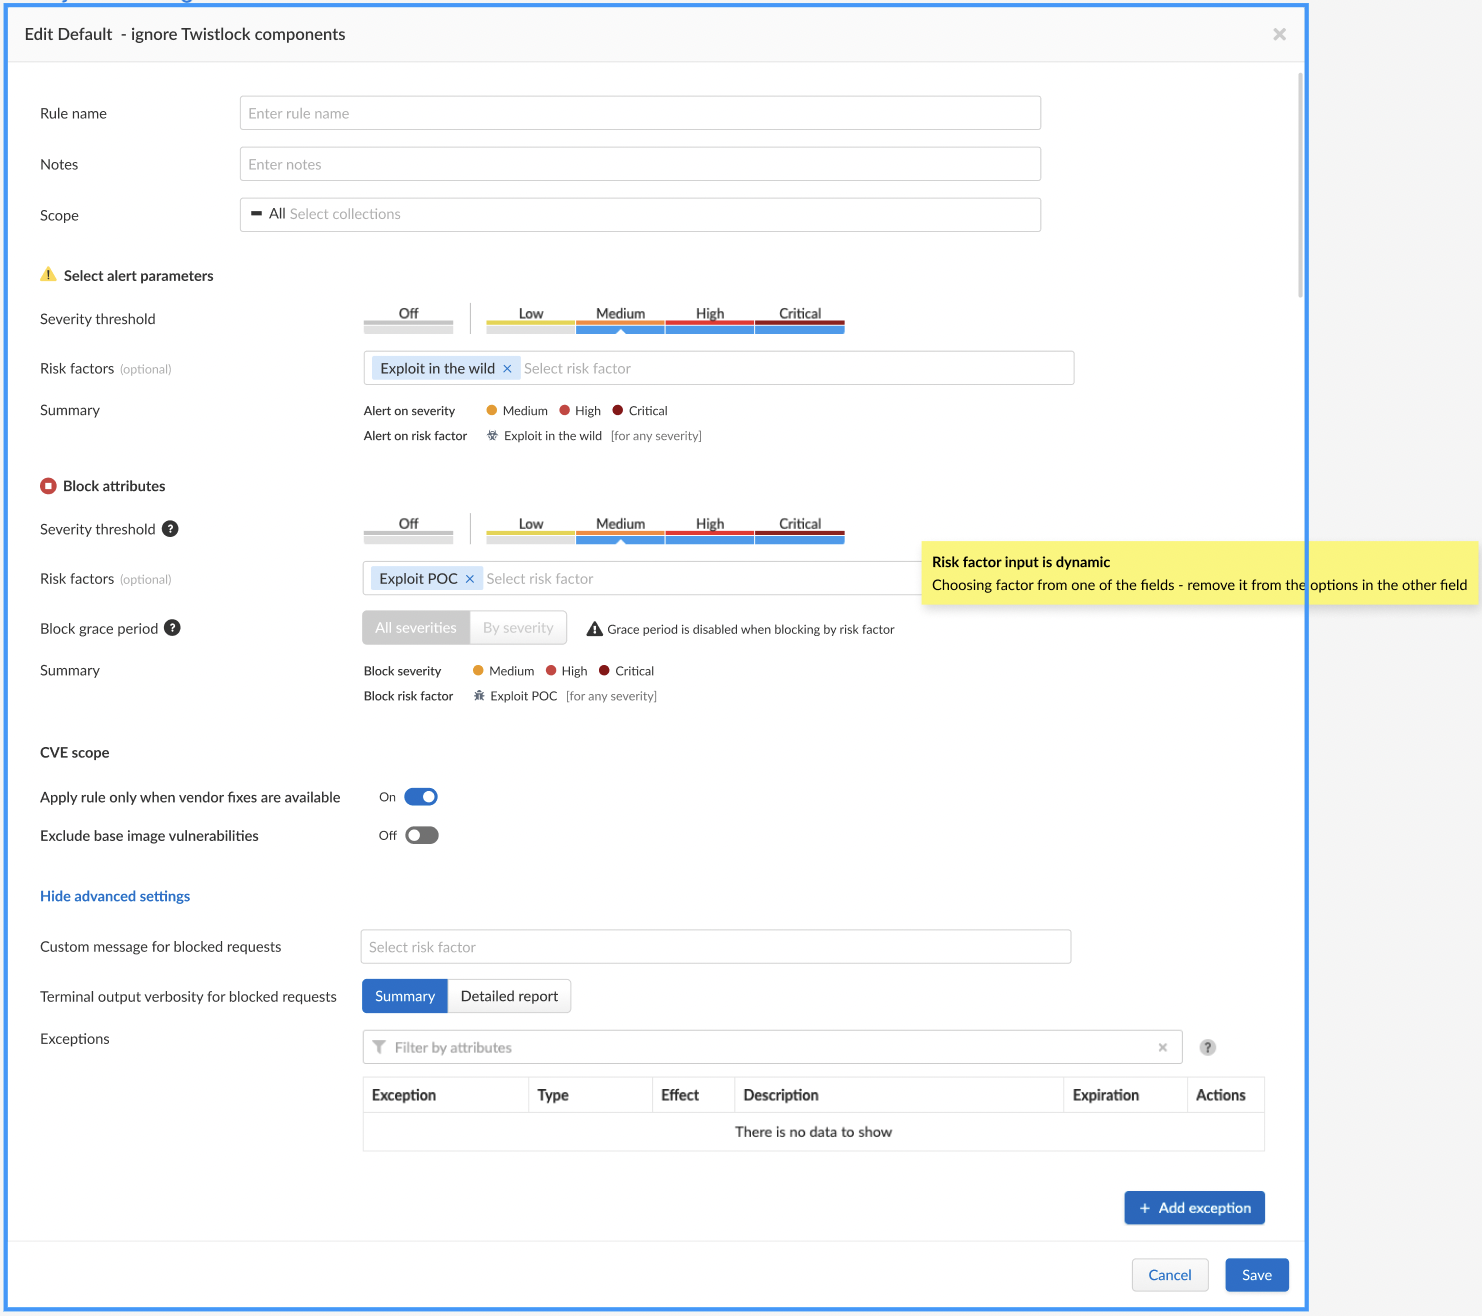
For deployed and CI images, you can trigger different actions such as alert, block, and fail based on risk factors - "Exploit in the wild" and "Exploit POC". All the vulnerabilities that match any severity threshold or the risk factors will be listed in the scan results under **Monitor > Vulnerabilities > Images > Deployed/Registries/CI**. For example, you can set an alert on the vulnerabilities with severity high and critical, and choose "exploit in the wild" so you will be also alerted on any vulnerability with this risk factor.
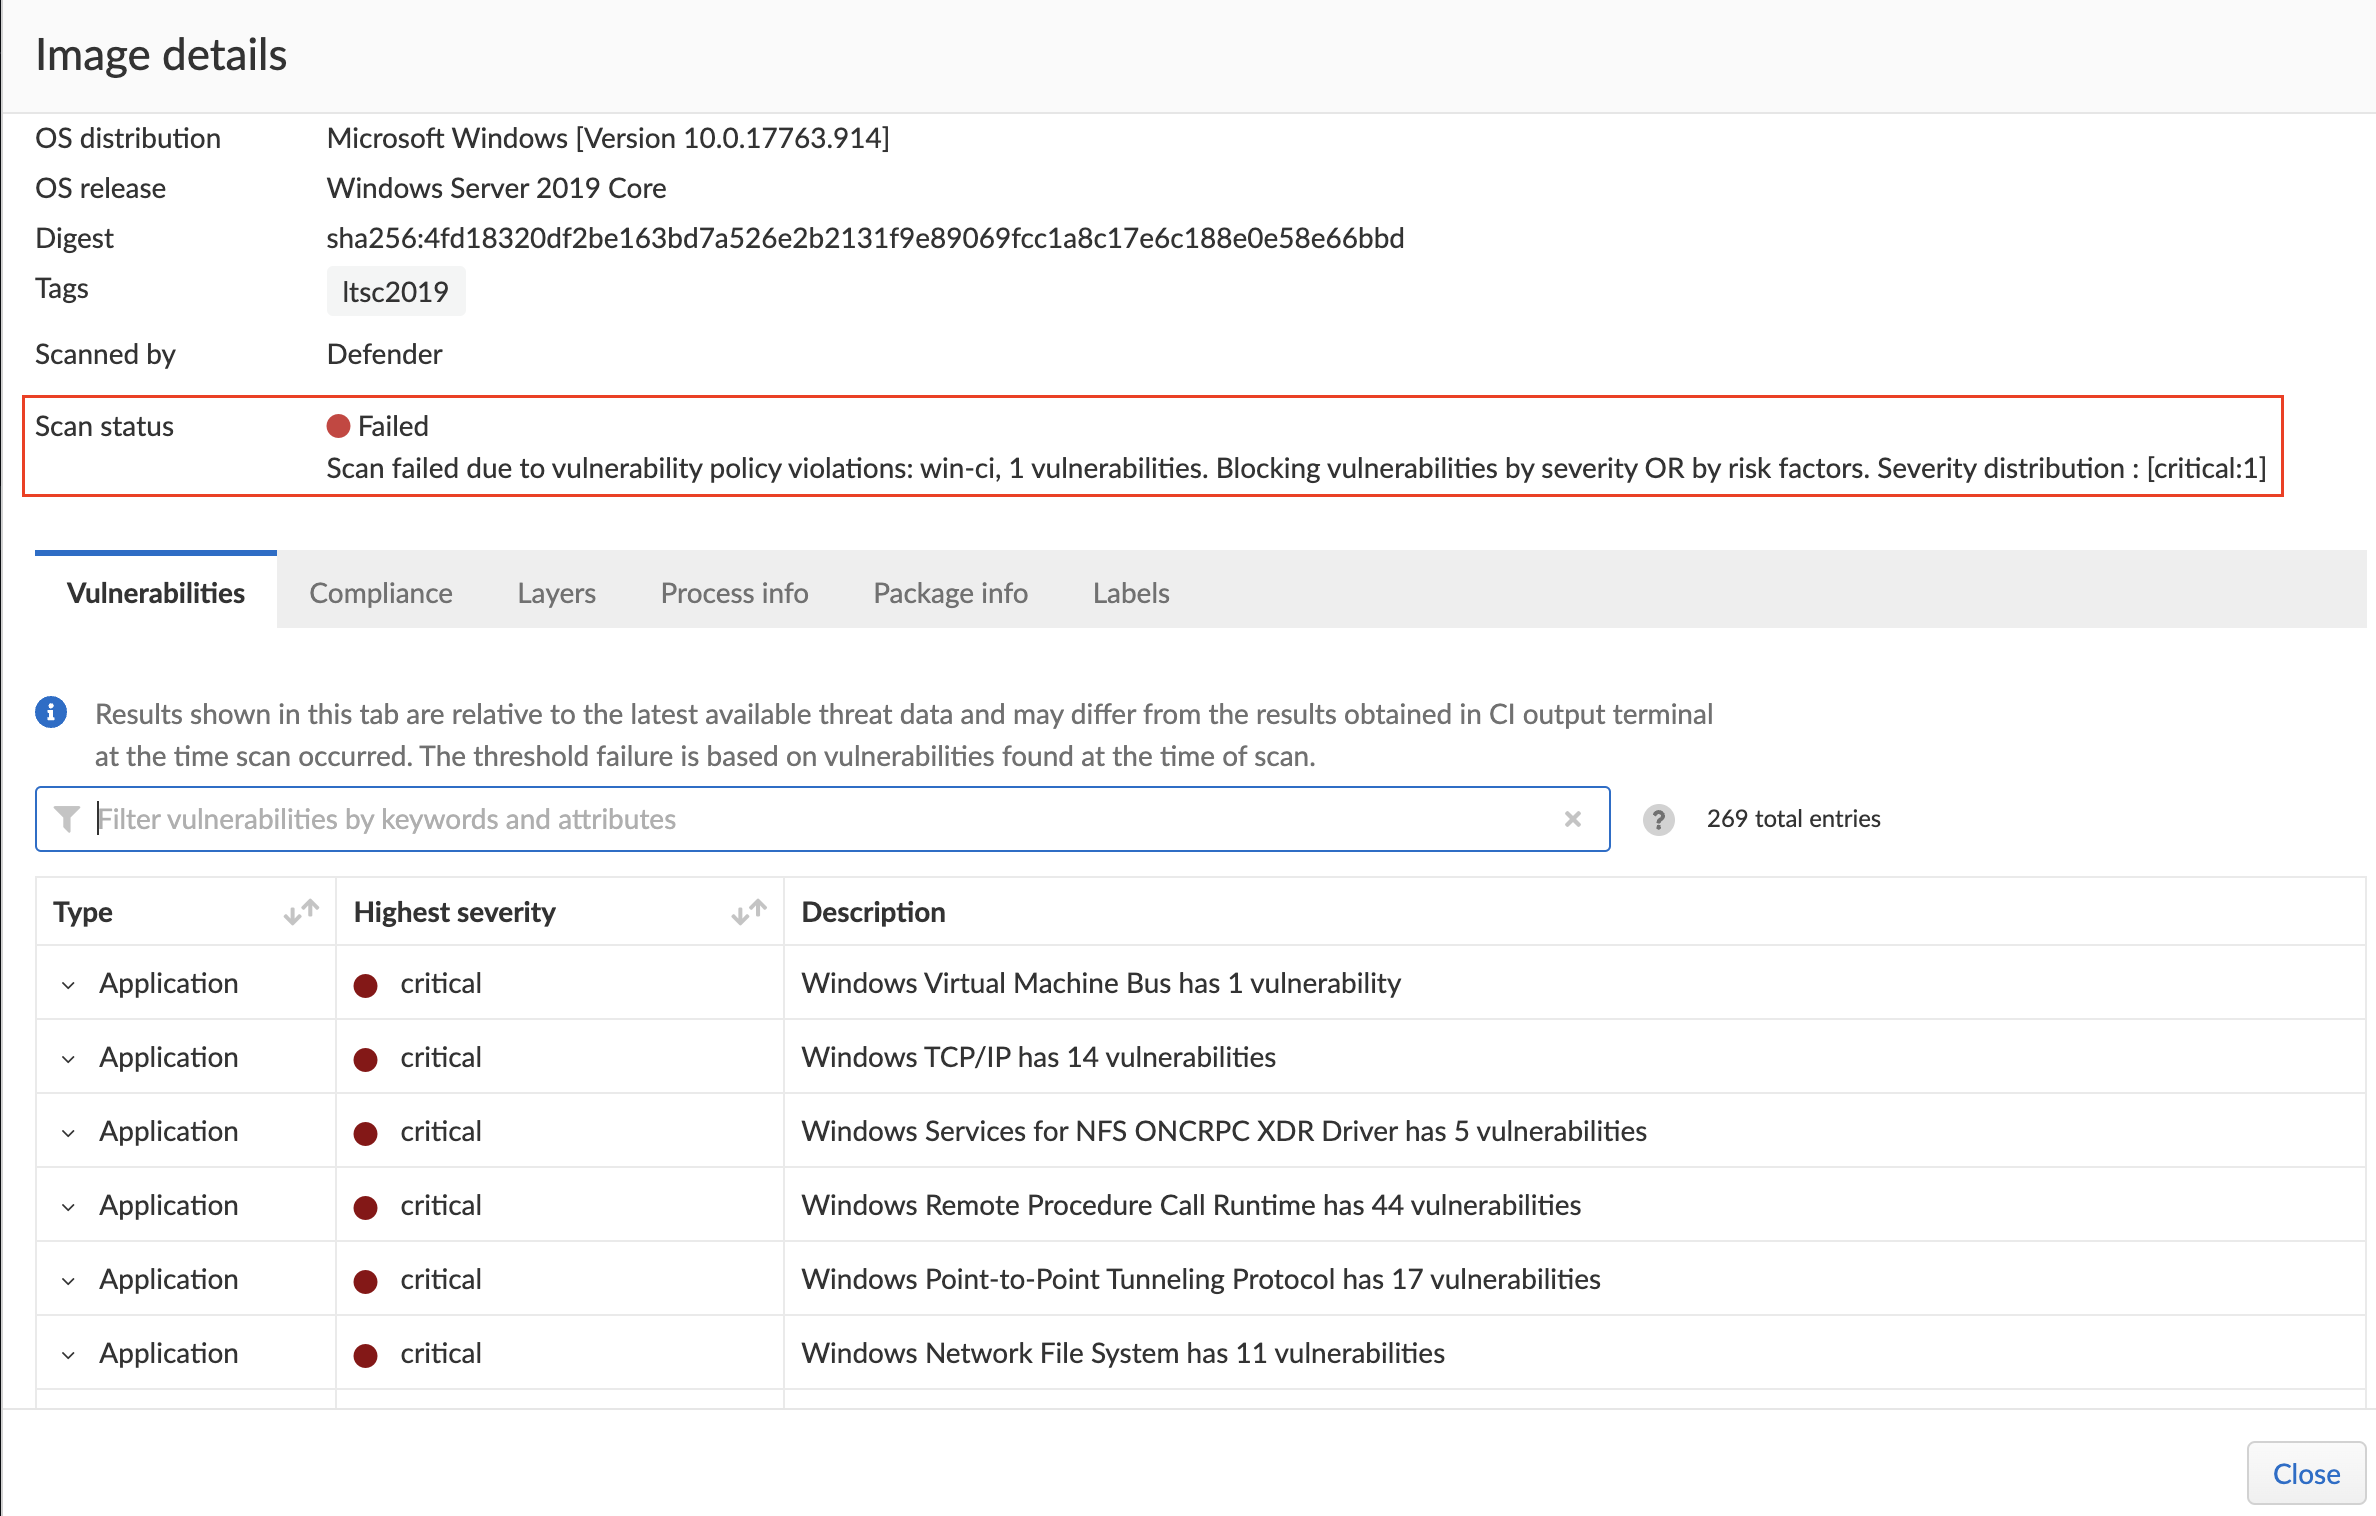
Image scan failed due to vulnerability policy violations by severity or by risk factors:
NOTE:
* Each risk factor can be selected once per alert or block notification.
* Setting the alert threshold to off allows all vulnerabilities for the resources in scope (as defined by your filters). Practically, resource nodes in Radar turn green (no issues to report), and scan reports are empty (no issues to report).
## Exclude Base Image Vulnerabilities
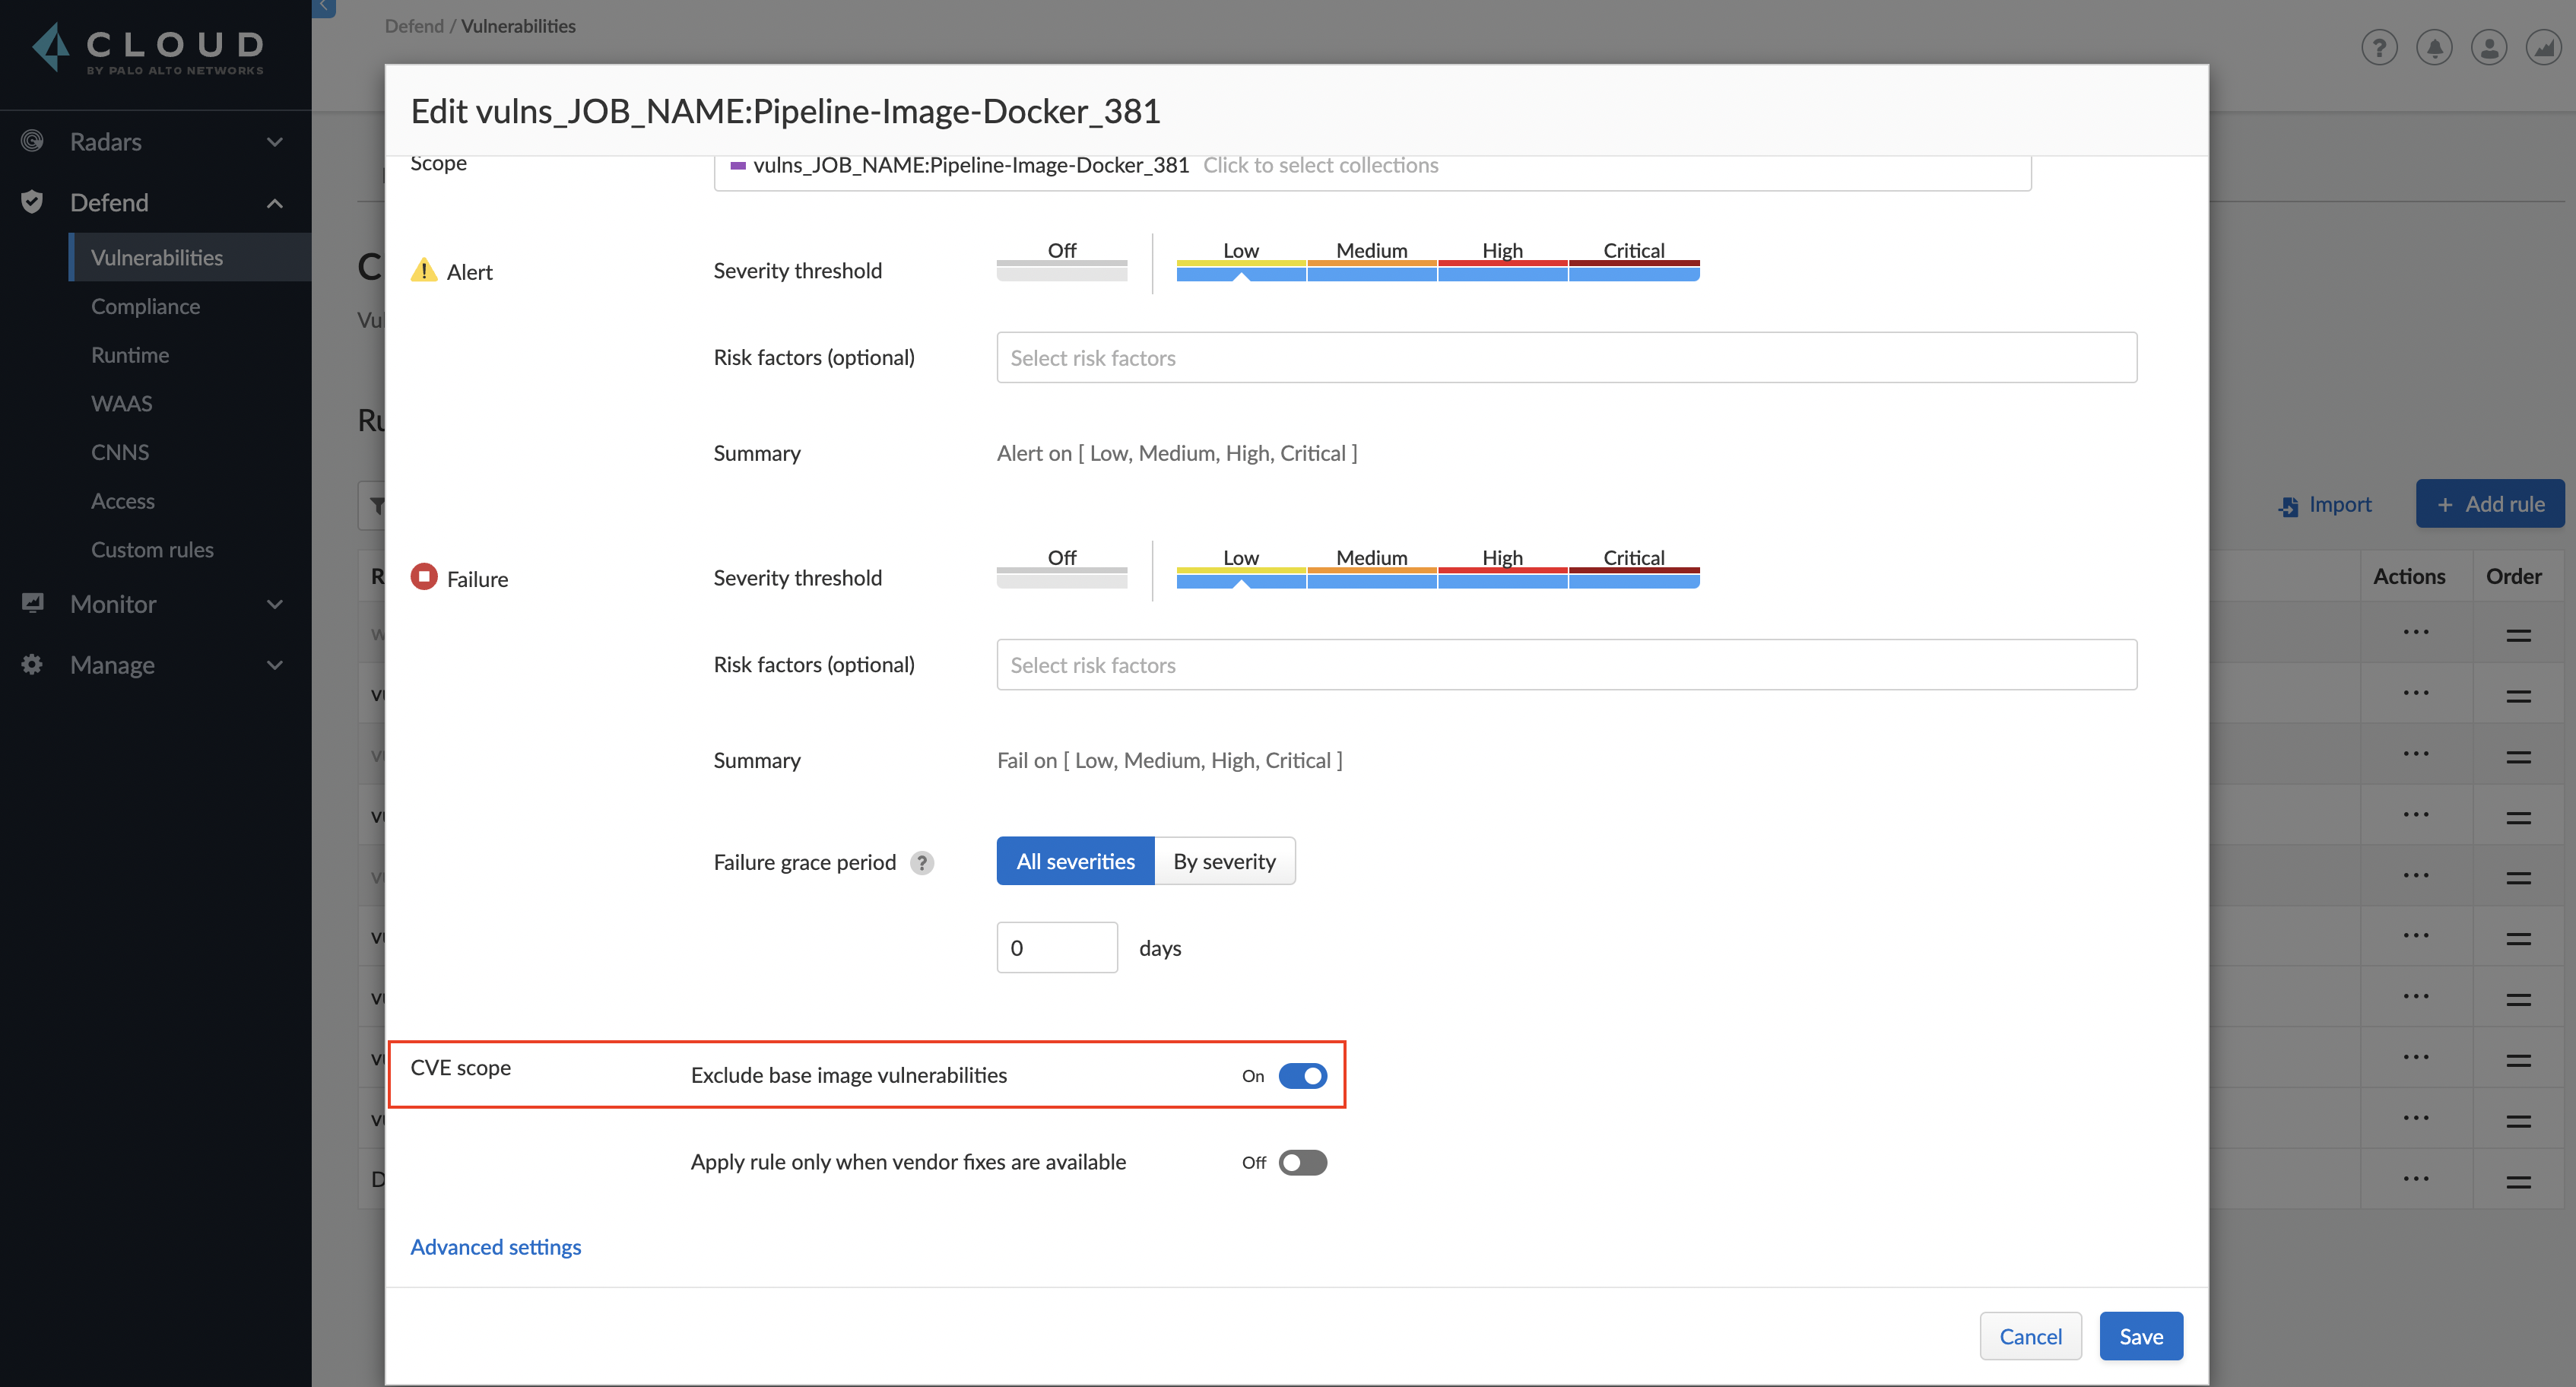
Enable **Exclude base image vulnerabilities** to ignore the vulnerabilities introduced by base images from being displayed on the monitor scan results. To use this feature, you need to first specify the base image under **Monitor > Vulnerabilities > Images > Base images**.
NOTE: Prisma Cloud does not support base image filtering for the images that are built using kaniko, owing to an issue in kaniko that filters out the vulnerabilities from the whole application.
## Scope
The scope field lets you target the rule to specific resources in your environment. The scope of a rule is defined by referencing one or more collections. By default, the scope is set to the **All** collection, which applies the rule globally. For more information about creating and managing collections, see [here](/content-collections/runtime-security/configure/collections.md).
## Vendor Fixes
Rules can be applied conditionally, depending on whether vendor fixes are available. For example, you could tune your policy to block the deployment of containers with a critical vulnerability *\*only if\** the vulnerable package has an update that resolves the issue. Otherwise, the deployment would be allowed to proceed.
Some vulnerabilities have a vendor status of "Will not fix". This status is applied when vendors don’t intend to resolve a vulnerability because it poses no significant risk to your environment.
## Rule Exceptions
You can configure Prisma Cloud to:
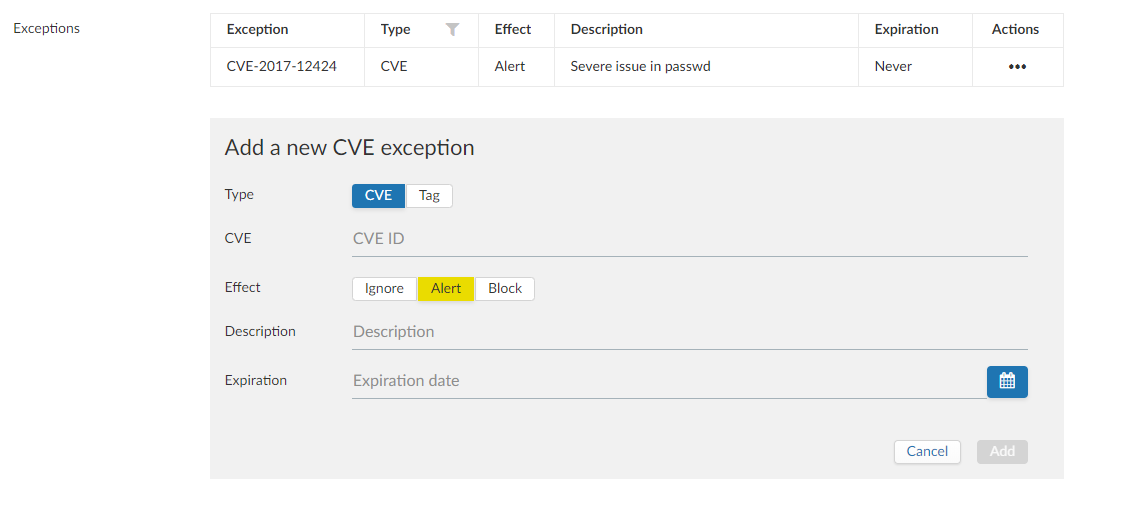
* Alert or block or fail on specific CVEs or tags (deny).
* Ignore specific CVEs or tags (allow).
Under **Advanced settings**, create a list of vulnerabilities and tags and specify how the scanner should handle them. Leaving the expiration date blank enforces the action until the CVE or tag is removed from the list. If you set an expiration date, and the current date is later than the expiration date, the scanner ignores the directive. The CVE or tag remains on the list even if it’s expired. It must be manually removed. Notice that for tag exceptions, in case of a conflict (a vulnerability with two tags or more that have different actions in the rule exceptions) there’s no guarantee what action will apply.
## Custom Terminal Output
Prisma Cloud lets you create rules that block access to resources or block the deployment of vulnerable containers. For example, you might create a rule that blocks the deployment of any image that has critical severity vulnerabilities. By default, when you try to run a vulnerable image, Prisma Cloud returns a terse response:
```
$ docker run -it ubuntu:14.04 sh
docker: Error response from daemon: [Prisma Cloud] Image operation blocked by policy: (sdf), has 44 vulnerabilities, [low:25 medium:19].
```
To help the operator better understand how to handle a blocked action, you can enhance Prisma Cloud’s default response by:
* Appending a custom message to the default message. For example, you could tell operators where to go to open a ticket.
* Configuring Prisma Cloud to return an itemized list of compliance issues rather than just a summary. This way, the operator does not need to contact the security team to determine which issues are preventing deployment. They are explicitly listed in the response.
When terminal output verbosity is set to **Detailed**, the response looks as follows:
```
$ docker run -it ubuntu:14.04 sh
docker: Error response from daemon: [Prisma Cloud] Image operation blocked by policy: (sdf), has 44 vulnerabilities, [low:25 medium:19].
Image ID CVE Package Version Severity Status
===== == === ======= ======= ======== ======
ubuntu:14.04 4333f1 CVE-2017-2518 sqlite3 3.8.2-1ubuntu2.1 medium deferred
ubuntu:14.04 4333f1 CVE-2017-6512 perl 5.18.2-2ubuntu1.1 medium needed
.
.
.
```
## Grace Period
Grace periods temporarily override the blocking action of a rule when new vulnerabilities are found. Grace periods give you time to address a vulnerability without compromising the availability of your app. You can configure a uniform grace period for all severities or provide different settings for each severity.
When grace periods are configured, alerts trigger as normal, notifying you that a vulnerability exists in your environment. The block action is suppressed for the number of days specified, giving you time to mitigate the vulnerability.
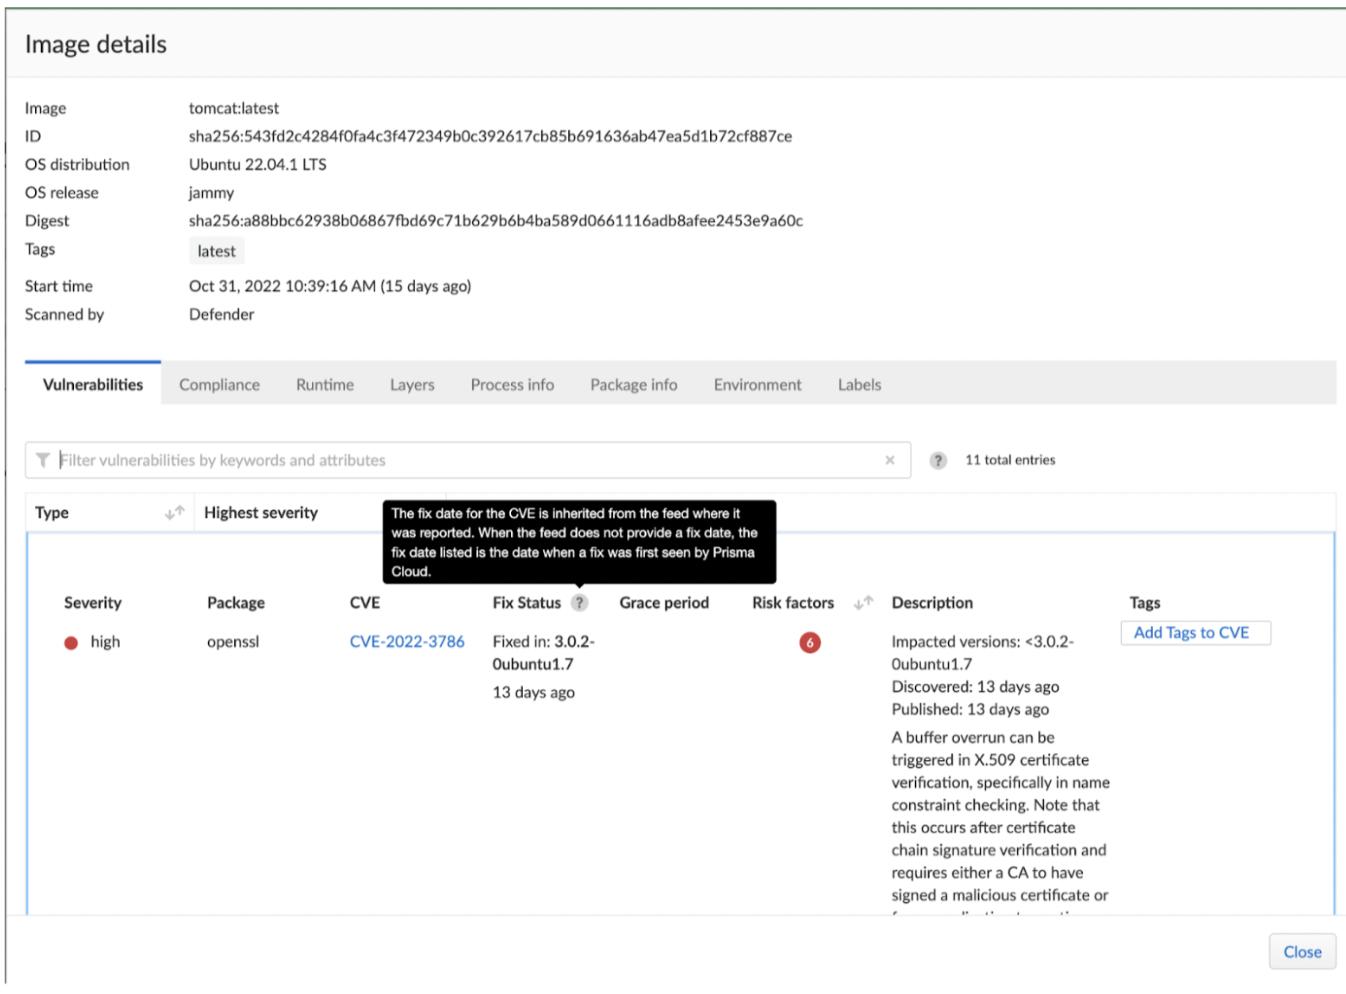
The start time for the grace period is the date the vulnerability was identified by the Intelligence Stream (IS), known as the "fix date". The end time is the fixed date plus the number of days configured for the grace period. For any feed collected by IS that does not provide a fix date for CVE, Prisma Cloud Compute will determine the fix date as the date when the fix for the CVE was first seen by the Intelligence Stream. Therefore, the calculation for the grace period will now start with the date on which the CVE fix was seen on the Intelligence Stream and not the CVE publish date.
For example, if a CVE was first discovered without a fix, and a fix was released later, the grace period for fixing the CVE would start from the date the fix was published, even though the vendor feed didn’t provide us with an explicit fix date.
For the feeds that do provide a fix date for the CVEs (such as RHEL), the fix date will always be determined as the fix date provided by the vendor, and the grace period will be calculated using this fix date.
There will be no change in the fix date for the existing CVEs in the IS, only the fix date for the new CVE fixes starting from Lagrange will change.
The Consoles from older versions will also be getting the change for CVEs with no fix date provided by the vendor, since the change was done on the Intelligence Stream (IS) side which supports all the Consoles.
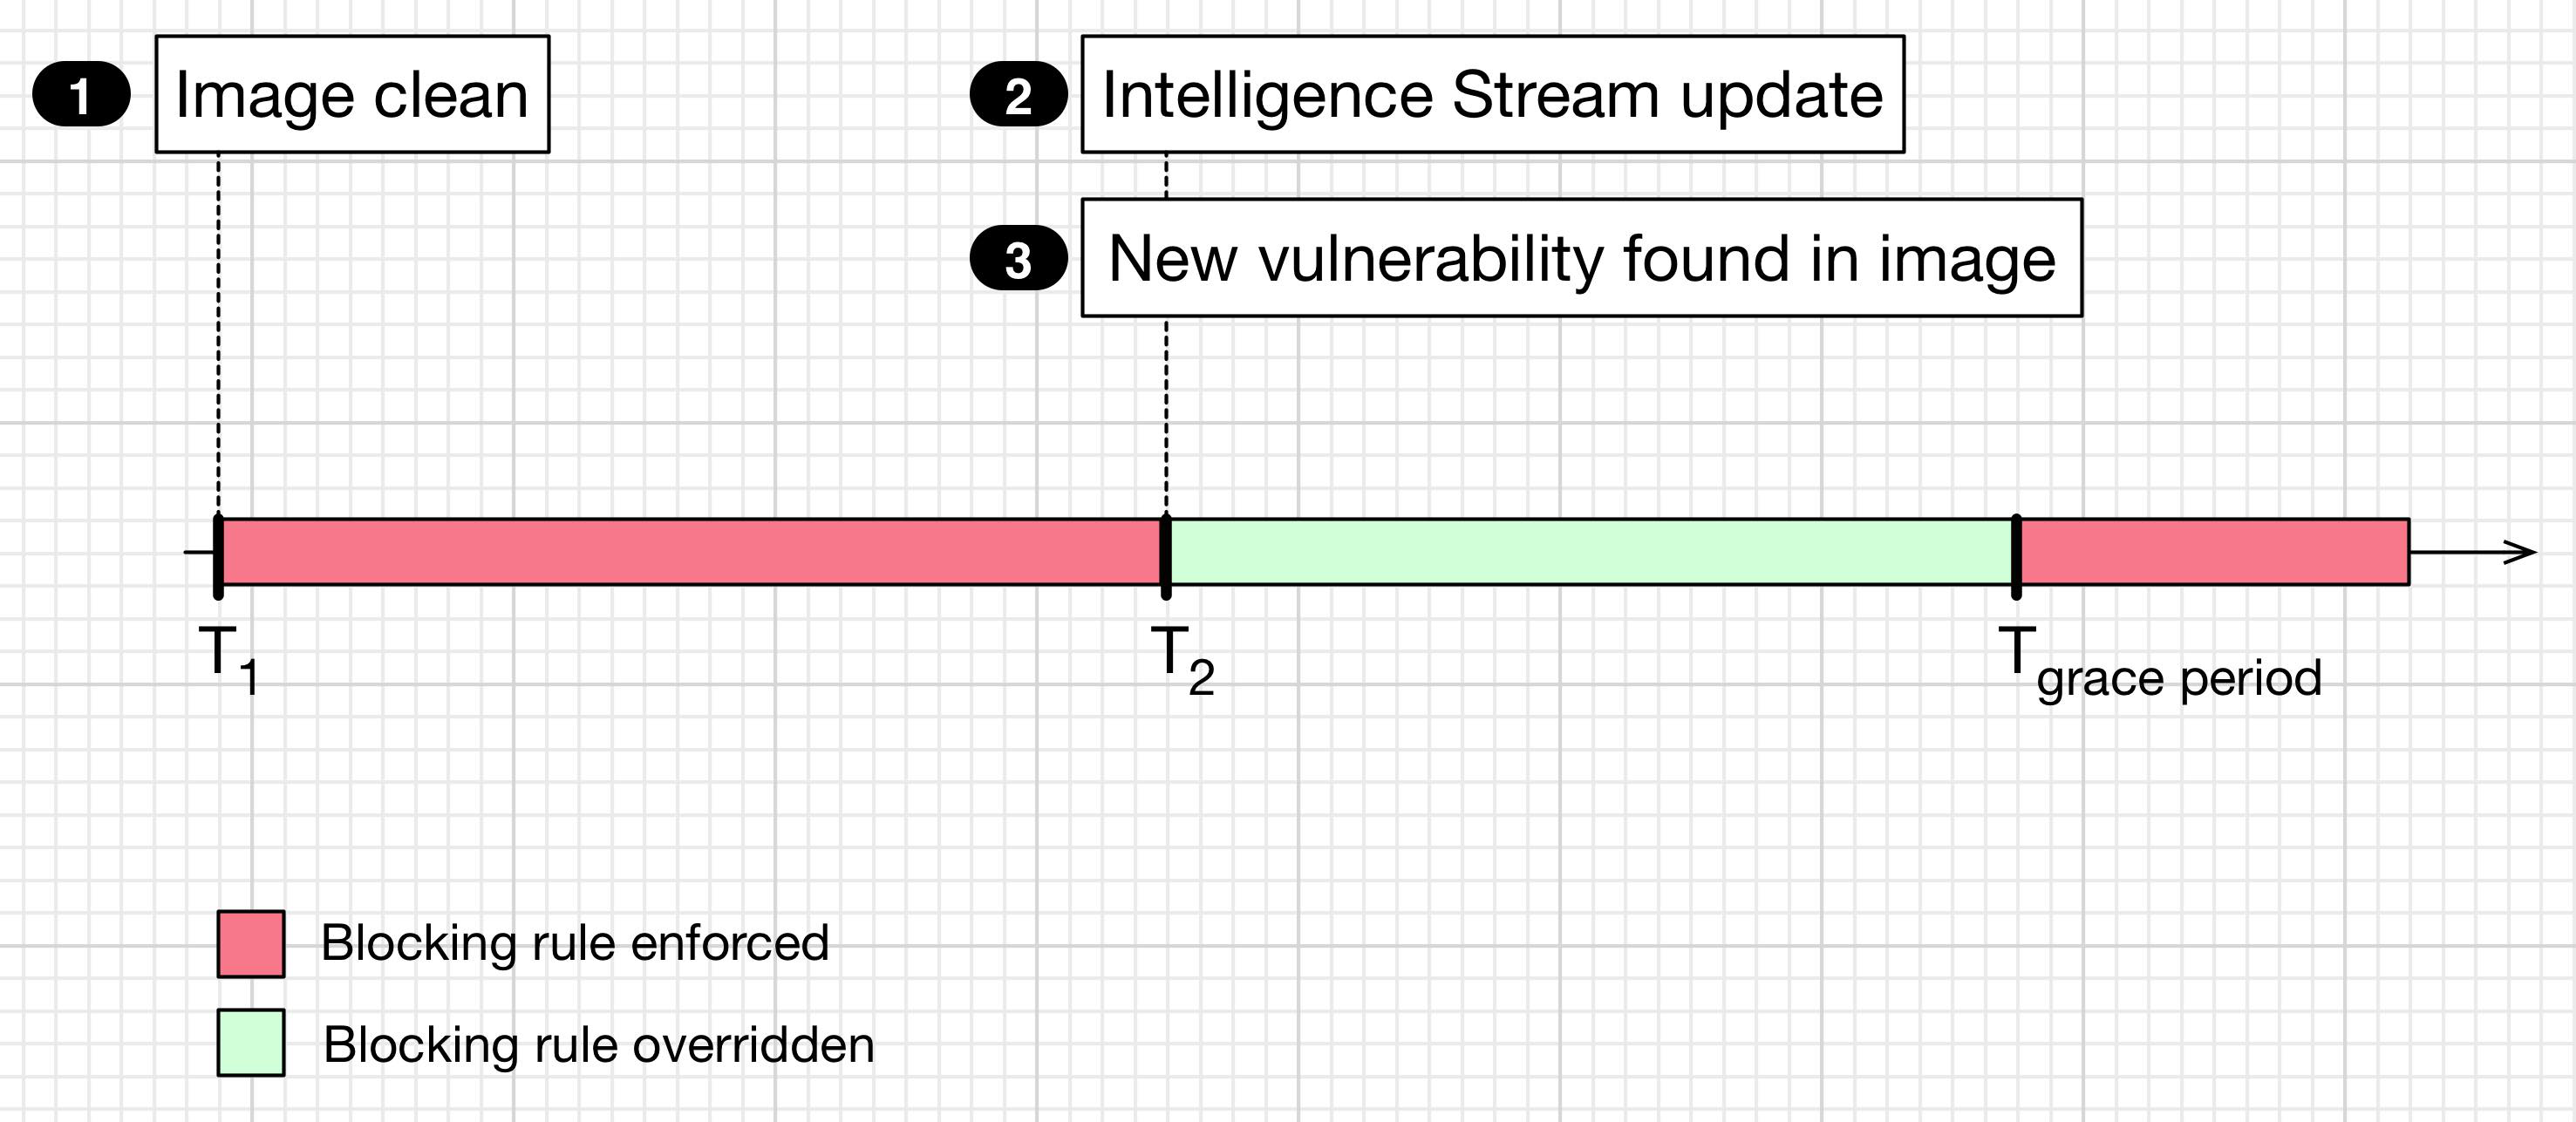
The following diagram shows how Prisma Cloud Defender responds to a vulnerability discovered in your environment. Assume you have a vulnerability rule that blocks the deployment of any image with critical vulnerabilities, and the grace period is 30 days.
* T1 — The image has passed the security gates in your CI pipeline. It has no critical vulnerabilities, so it’s pushed to the registry.
* T1 - T2 — The orchestrator runs the image in your cluster. The image has no critical vulnerabilities, so Defender allows it to run.
* T2 — Prisma Cloud Intelligence Stream acquires new threat data that identifies a critical vulnerability in the image. The package vendor released a fix as soon as the vulnerability was disclosed. In the next scan (by default, scans run every 24 hours), Prisma Cloud reports the vulnerability, and raises an alert if alerts are configured in the vulnerability rule.
* T2 - Tgrace\_period — Prisma Cloud temporarily overrides the block rule, while the dev team addresses the vulnerability. The orchestrator can continue to pull copies of the image into your environment and run it.
* Tgrace\_period — Grace period expires. If the vulnerability has not been fixed yet, Prisma Cloud blocks any new deployments of the image from this time forward.
Grace periods are a policy setting that’s available for all components that enforce vulnerability policy, namely Defender, twistcli, and the Jenkins plugin. In order to surface the issue as early as possible in the development lifecycle, you can specify a grace period in the CI pipeline. For example, this control would let you fail image builds that have critical vulnerabilities that were fixed over 30 days ago.
The Grace period is disabled when the vulnerabilities are blocked by risk factors. This is because risk factors are tracked independently of CVE severity, and they can be assigned for blocking without CVE severity. If a rule detects either a Risk Factor or a Vulnerability that meets the threshold, the policy effect in the rule is applied to the resources in scope immediately. As a result, risk factor can be assigned for blocking without CVE severity.
### Configure Grace Period
The following procedure describes how to configure grace periods for blocking actions:
1. In Console, go to **Defend > Vulnerabilities > Images/Hosts > Deployed/CI**.
2. Select an existing rule or create a new rule with the **Add rule** button.
3. Enter a rule name, notes, and scope.
4. Select the desired Alert/Block/Failure threshold based on Severity/Risk factors.
The block threshold must be equal to or greater than the alert threshold. You must define a block threshold to configure grace period.
1. Configure the **Block grace period**:
1. Select whether you would like to define the same grace period for **All severities** or grace period **By severity**.
2. Specify the number of days. Note that in case of **By severity** grace period you will be able to specify the number of days only for the severities that can be blocked. Values that are not set will be set to 0.
Use the same procedure to configure grace periods to fail builds in your CI/CD pipeline. To configure CI/CD pipeline vulnerability scanning rules, go to **Defend > Vulnerabilities > Images > CI**.
### Elapsed Time
All scan reports show whether a vulnerability has been fixed (fix status) and when it was fixed (fix date), and the time remaining in the grace period. Scan reports are available from the:
* Console UI.
* Console UI as a CSV or PDF download.
* API (JSON or CSV).
* Jenkins plugin.
* twistcli.
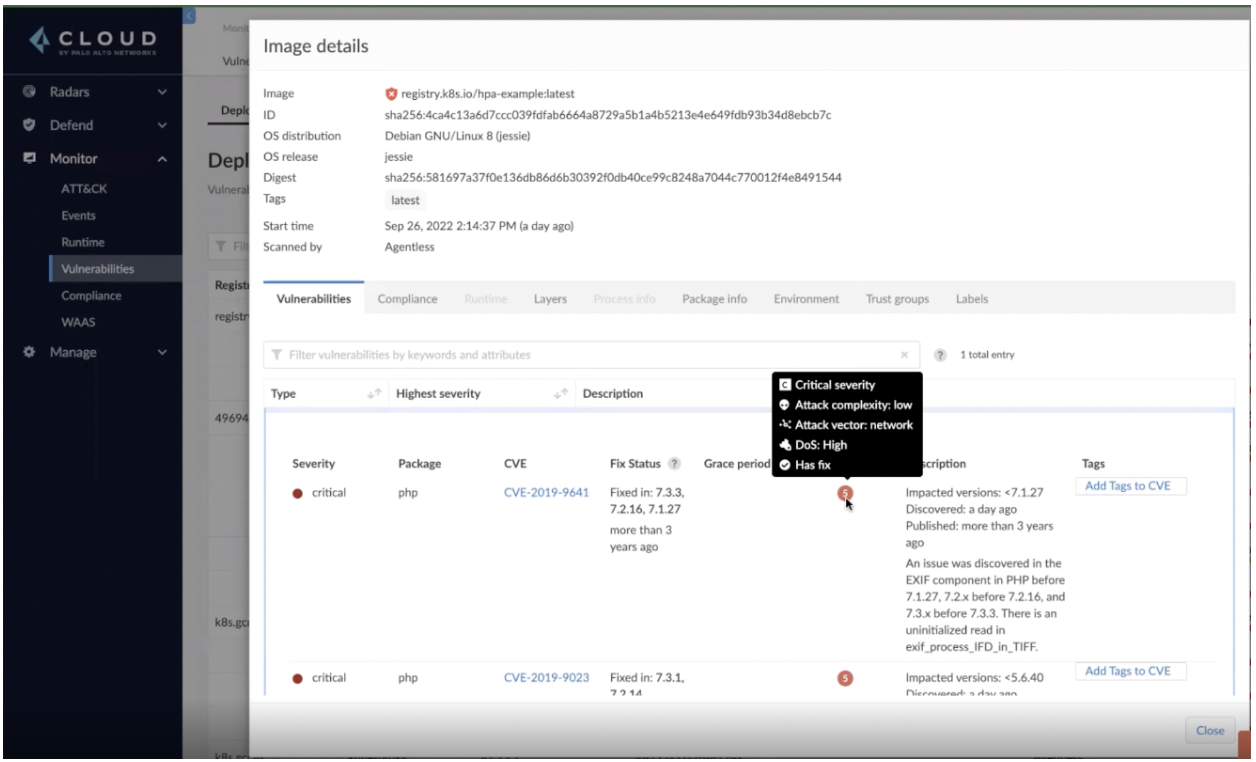
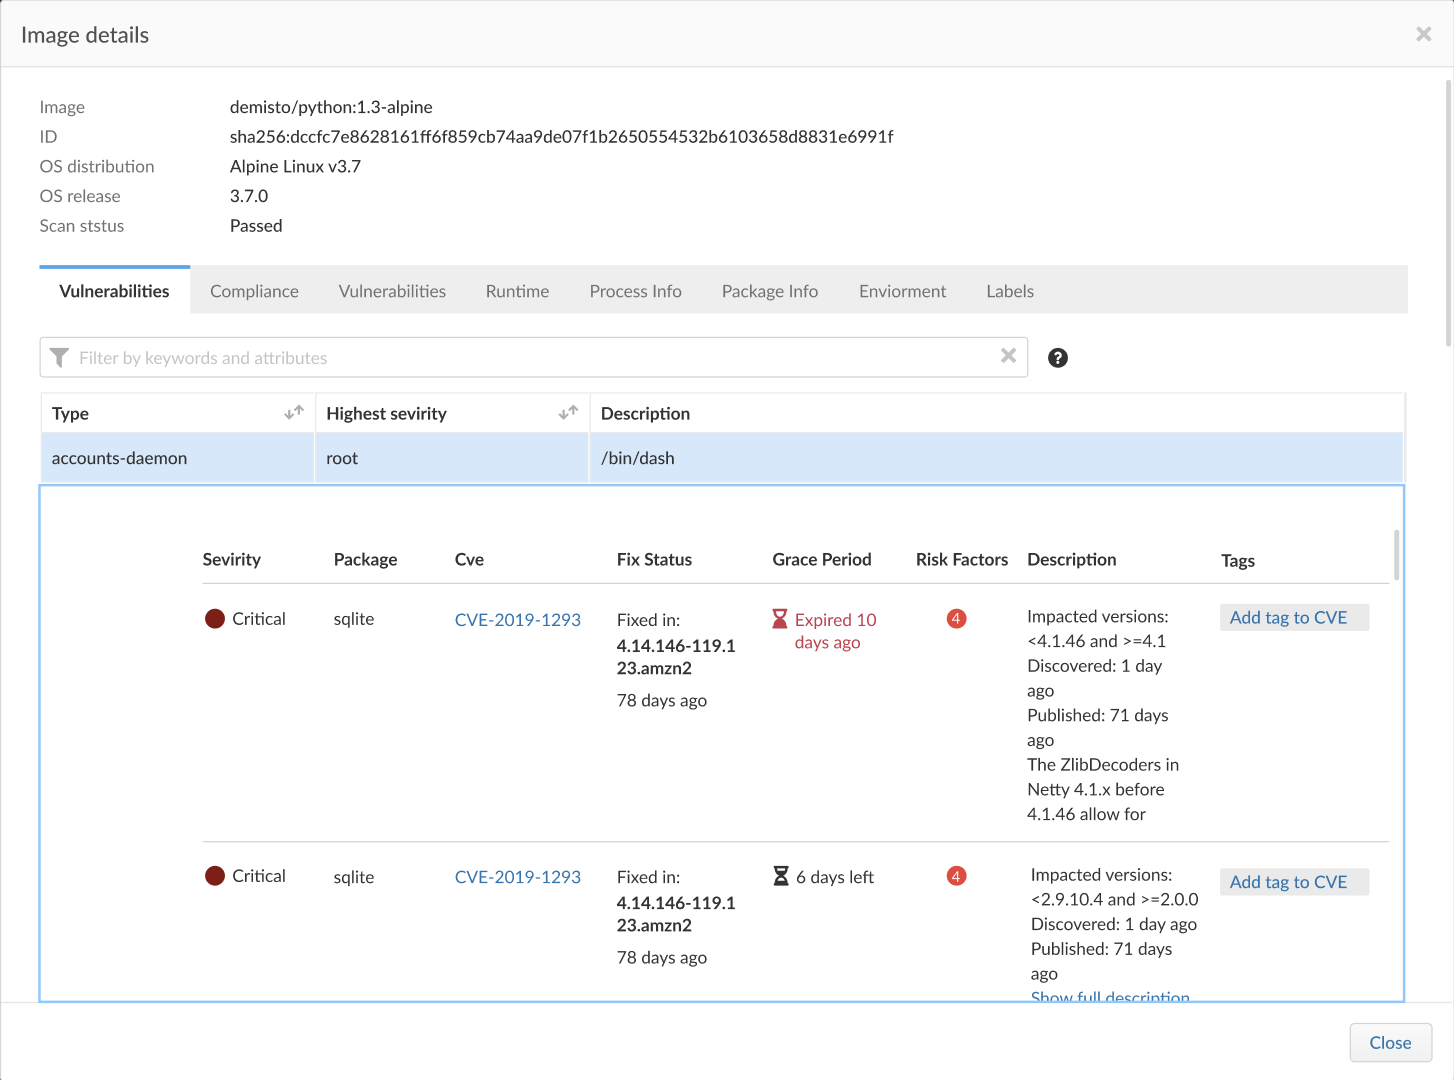
The following example screenshot shows how the status of grace periods is displayed. Grace periods are either still in force or expired. For grace periods in force, the number of days remaining in the grace period is displayed. For grace periods that have expired, the number of days since they expired is displayed. Scan reports for running images can be retrieved from **Monitor > Vulnerabilities > Images > Deployed**.
The following screenshot shows how the data is represented in the CSV scan report:
## Blocking Based on Vulnerability Severity
This example shows you how to create and test a rule that blocks the deployment of images with critical or high-severity vulnerabilities.
1. In Console, go to **Defend > Vulnerabilities > Images**.
2. Click **Add rule**.
1. Enter a rule name, such as **my-rule**.
2. Set both **Alert** and **Block** **Severity threshold** to **High**.
3. Target the rule to a very specific image. Under **Scope > Images** filter, delete the wildcard, and enter **nginx\***.
4. Click **Save**.
3. Validate your policy by pulling down the nginx image and running it.
1. SSH to a host protected by Defender.
2. Pull the nginx:1.14 image.
```
$ docker pull nginx:1.14
```
3. Run the nginx image.
```
$ docker run -it nginx:1.14 /bin/sh
docker: Error response from daemon: oci runtime error: [Prisma Cloud] Image operation blocked by policy: my-rule, has 7 vulnerabilities, [high:7].
```
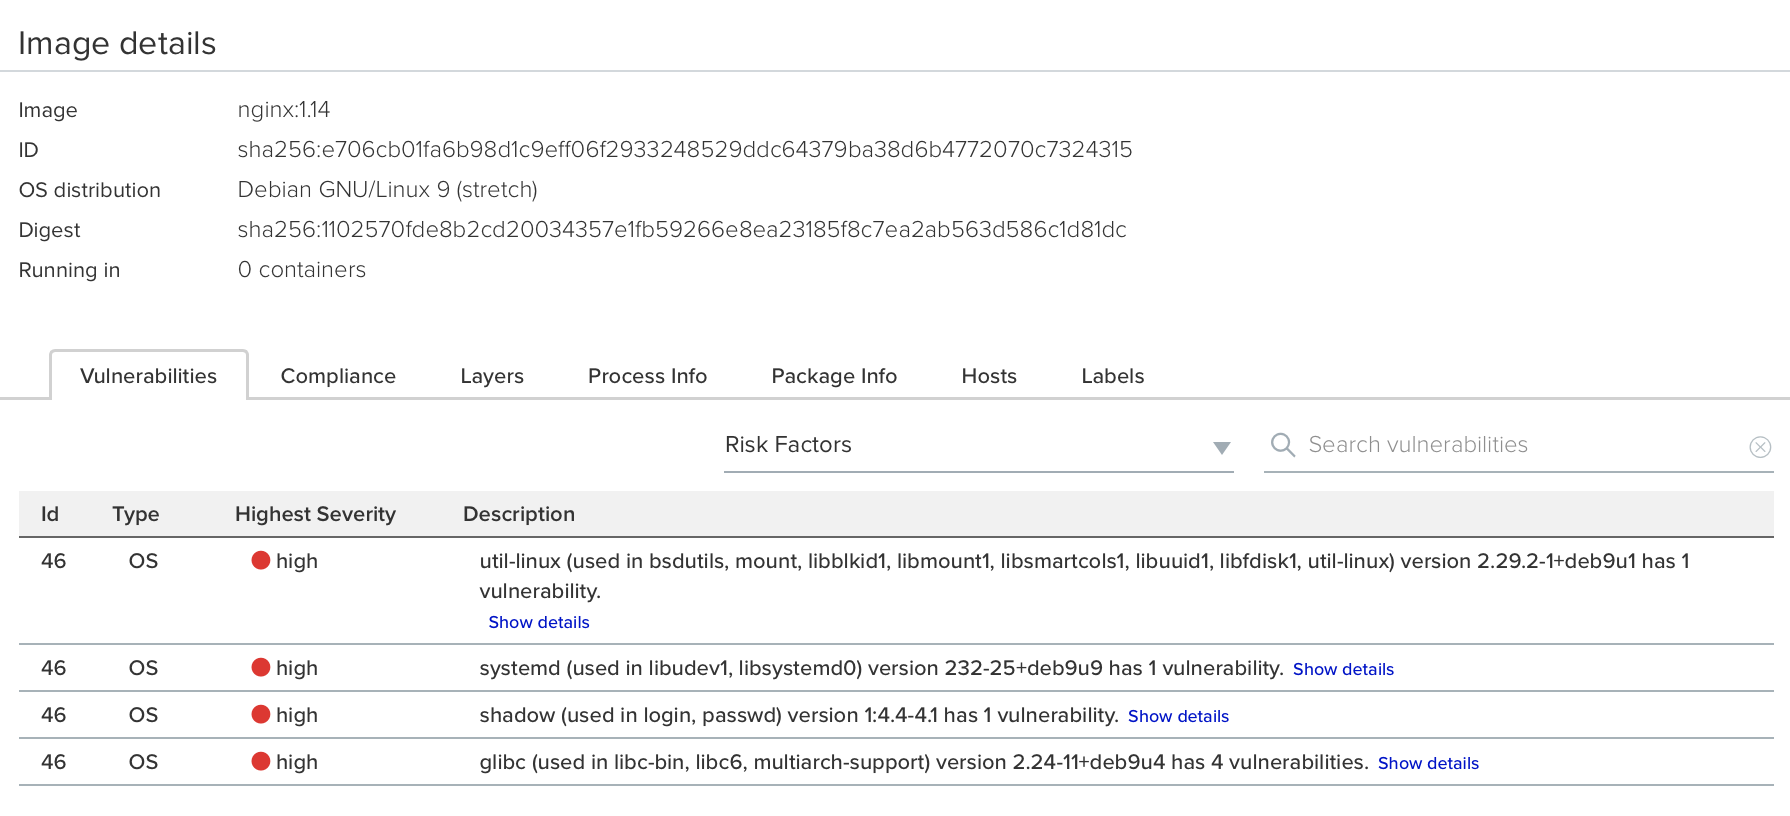
4. Review the scan report for nginx:1.14. Go to **Monitor > Vulnerabilities > Images**, and click on the entry for nginx:1.14. You’ll see several high-severity vulnerabilities.
By default, Prisma Cloud optimizes resource usage by only scanning images with running containers. Therefore, you won’t see a scan report for nginx until it’s run.
5. Review the audit (alert) for the block action. Go to **Monitor > Events**, then click on **Docker**.
## Blocking Specific CVEs
This example shows you how to create and test a rule that blocks images with a specific CVE.
1. In Console, go to **Defend > Vulnerabilities > Images**.
2. Click **Add rule**.
1. Enter a **Rule name, such as \*my-rule2**.
2. Click **Advanced settings**.
3. In **Exceptions**, click **Add Exception**.
4. In **CVE**, enter **CVE-2018-8014**.
You can find specific CVE IDs in the image scan reports. Go to **Monitor > Vulnerabilities > Images**, select an image, then click **Show details** in each row.
5. In **Effect**, select **Block**.
6. Click **Add**.
7. Click **Save**.
3. Try running an image with the CVE that you’ve explicitly denied.
```
$ docker run -it imiell/bad-dockerfile:latest /bin/sh
docker: Error response from daemon: oci runtime error: [Prisma Cloud] Image operation blocked by policy: my-rule2, has specific CVE CVE-2018-8014
```
## Ignoring Specific CVEs
Follow the same procedure as above, but set the action to **Ignore** instead of **Block**. This will allow any CVE ID that you’ve defined in the rule, and lets you run images containing those CVEs in your environment.
## Restrict Scanning to a Specific Region
You can configure Prisma Cloud to scan only in a specific cloud region. This helps reduce unnecessary scans and focus on relevant security risks.
To restrict serverless scanning to a specific region:
1. Open Console.
2. Go to **Defend > Vulnerabilities > {Images | Hosts | Functions}**.
3. Click **Add rule**.
4. Enter a rule name and configure the rule.
5. In the rule configuration, add a **Collection** that includes resources deployed in the specific cloud region.
For more information on creating collections, see [Collections](admin-guide:vulnerability-management:collections.md).
6. Click **Save**.
7. View the impact of your rule by navigating to **Monitor** > **Vulnerabilities** > **Functions** to review scan reports.
This setting ensures that only Prisma Cloud scans only the specified region.
---
# Agent Instructions
This documentation is published with GitBook. GitBook is the documentation platform designed so that both humans and AI agents can read, navigate, and reason over technical content effectively. Learn more at gitbook.com.
## Querying This Documentation
If you need additional information that is not directly available in this page, you can query the documentation dynamically by asking a question.
Perform an HTTP GET request on the current page URL with the `ask` query parameter, and the optional `goal` query parameter:
```
GET https://docs.prismacloud.io/content-collections/runtime-security/vulnerability-management/vulnerability-management-policies.md?ask=&goal=
```
`ask` is the immediate question: it should be specific, self-contained, and written in natural language.
`goal` is optional and describes the broader end goal you are ultimately trying to accomplish on behalf of the user. GitBook uses it to tailor the answer towards what is most useful for that goal.
The response will contain a direct answer to the question and relevant excerpts and sources from the documentation.
Use this mechanism when the answer is not explicitly present in the current page, you need clarification or additional context, or you want to retrieve related documentation sections.