> For the complete documentation index, see [llms.txt](https://docs.prismacloud.io/llms.txt). Markdown versions of documentation pages are available by appending `.md` to page URLs; this page is available as [Markdown](https://docs.prismacloud.io/content-collections/search-and-investigate/explore-data.md).
# Explore Data and Create Custom Attack Path Policies
After [building a query](/content-collections/search-and-investigate/build-modify-queries.md), you can analyze the results to perform an in-depth analysis of security issues across your entire engineering ecosystem. You can explore your cloud security environment and combine the deep security context to find the risky areas you want your organization to focus on. For example, you want to find which assets in your cloud are impacted by the latest log5j vulnerability, investigate the latest incidents identified in your environment, and explore what risk factors could have contributed to the incident. You can point and click to quickly and easily explore your cloud assets and security data without the need to learn a new complex query language.
The query result, displayed in **Graph View** includes the following components:
* **Nodes**: Assets of a repository that can include entities.
* **Edges**: Connections between nodes.
* **Export**: Download graph data as a .png image or JSON file.
* **Controls**: Zoom and reset.
## Nodes
To view a node’s details, select on a node on the graph and select **Info**. The **Details** panel opens, displaying the node’s details as well as entities grouped under the node. The node’s edges and connections to other nodes are also displayed on the graph.
**Node Entities**
Nodes of the same type are grouped and displayed under a single group node. A number in the node indicates that the node is a group node, as well as the number of entities in the group. You can view all entities and entity details from the group and display it independently on the graph.
To view all entities of a group node:
1. Open the group node **Details** panel.
2. Click on the group node and select a node under the **Expanded nodes field**. The node is regrouped under the group node and is displayed under the **Collapsed node** field.
## Edges
Edges are the connections that display the relationships between nodes. The path arrow indicates the direction between the source and target node.
To view the relationship between a node and edge, click on a node. The node’s connections to other nodes are displayed. Details of the relationship including the type and direction of the relation are also displayed.
To view details of a connection, click on a connection. The connection **Details** panel opens, displaying the source and target nodes connected by the connection, as well as the type of connection.
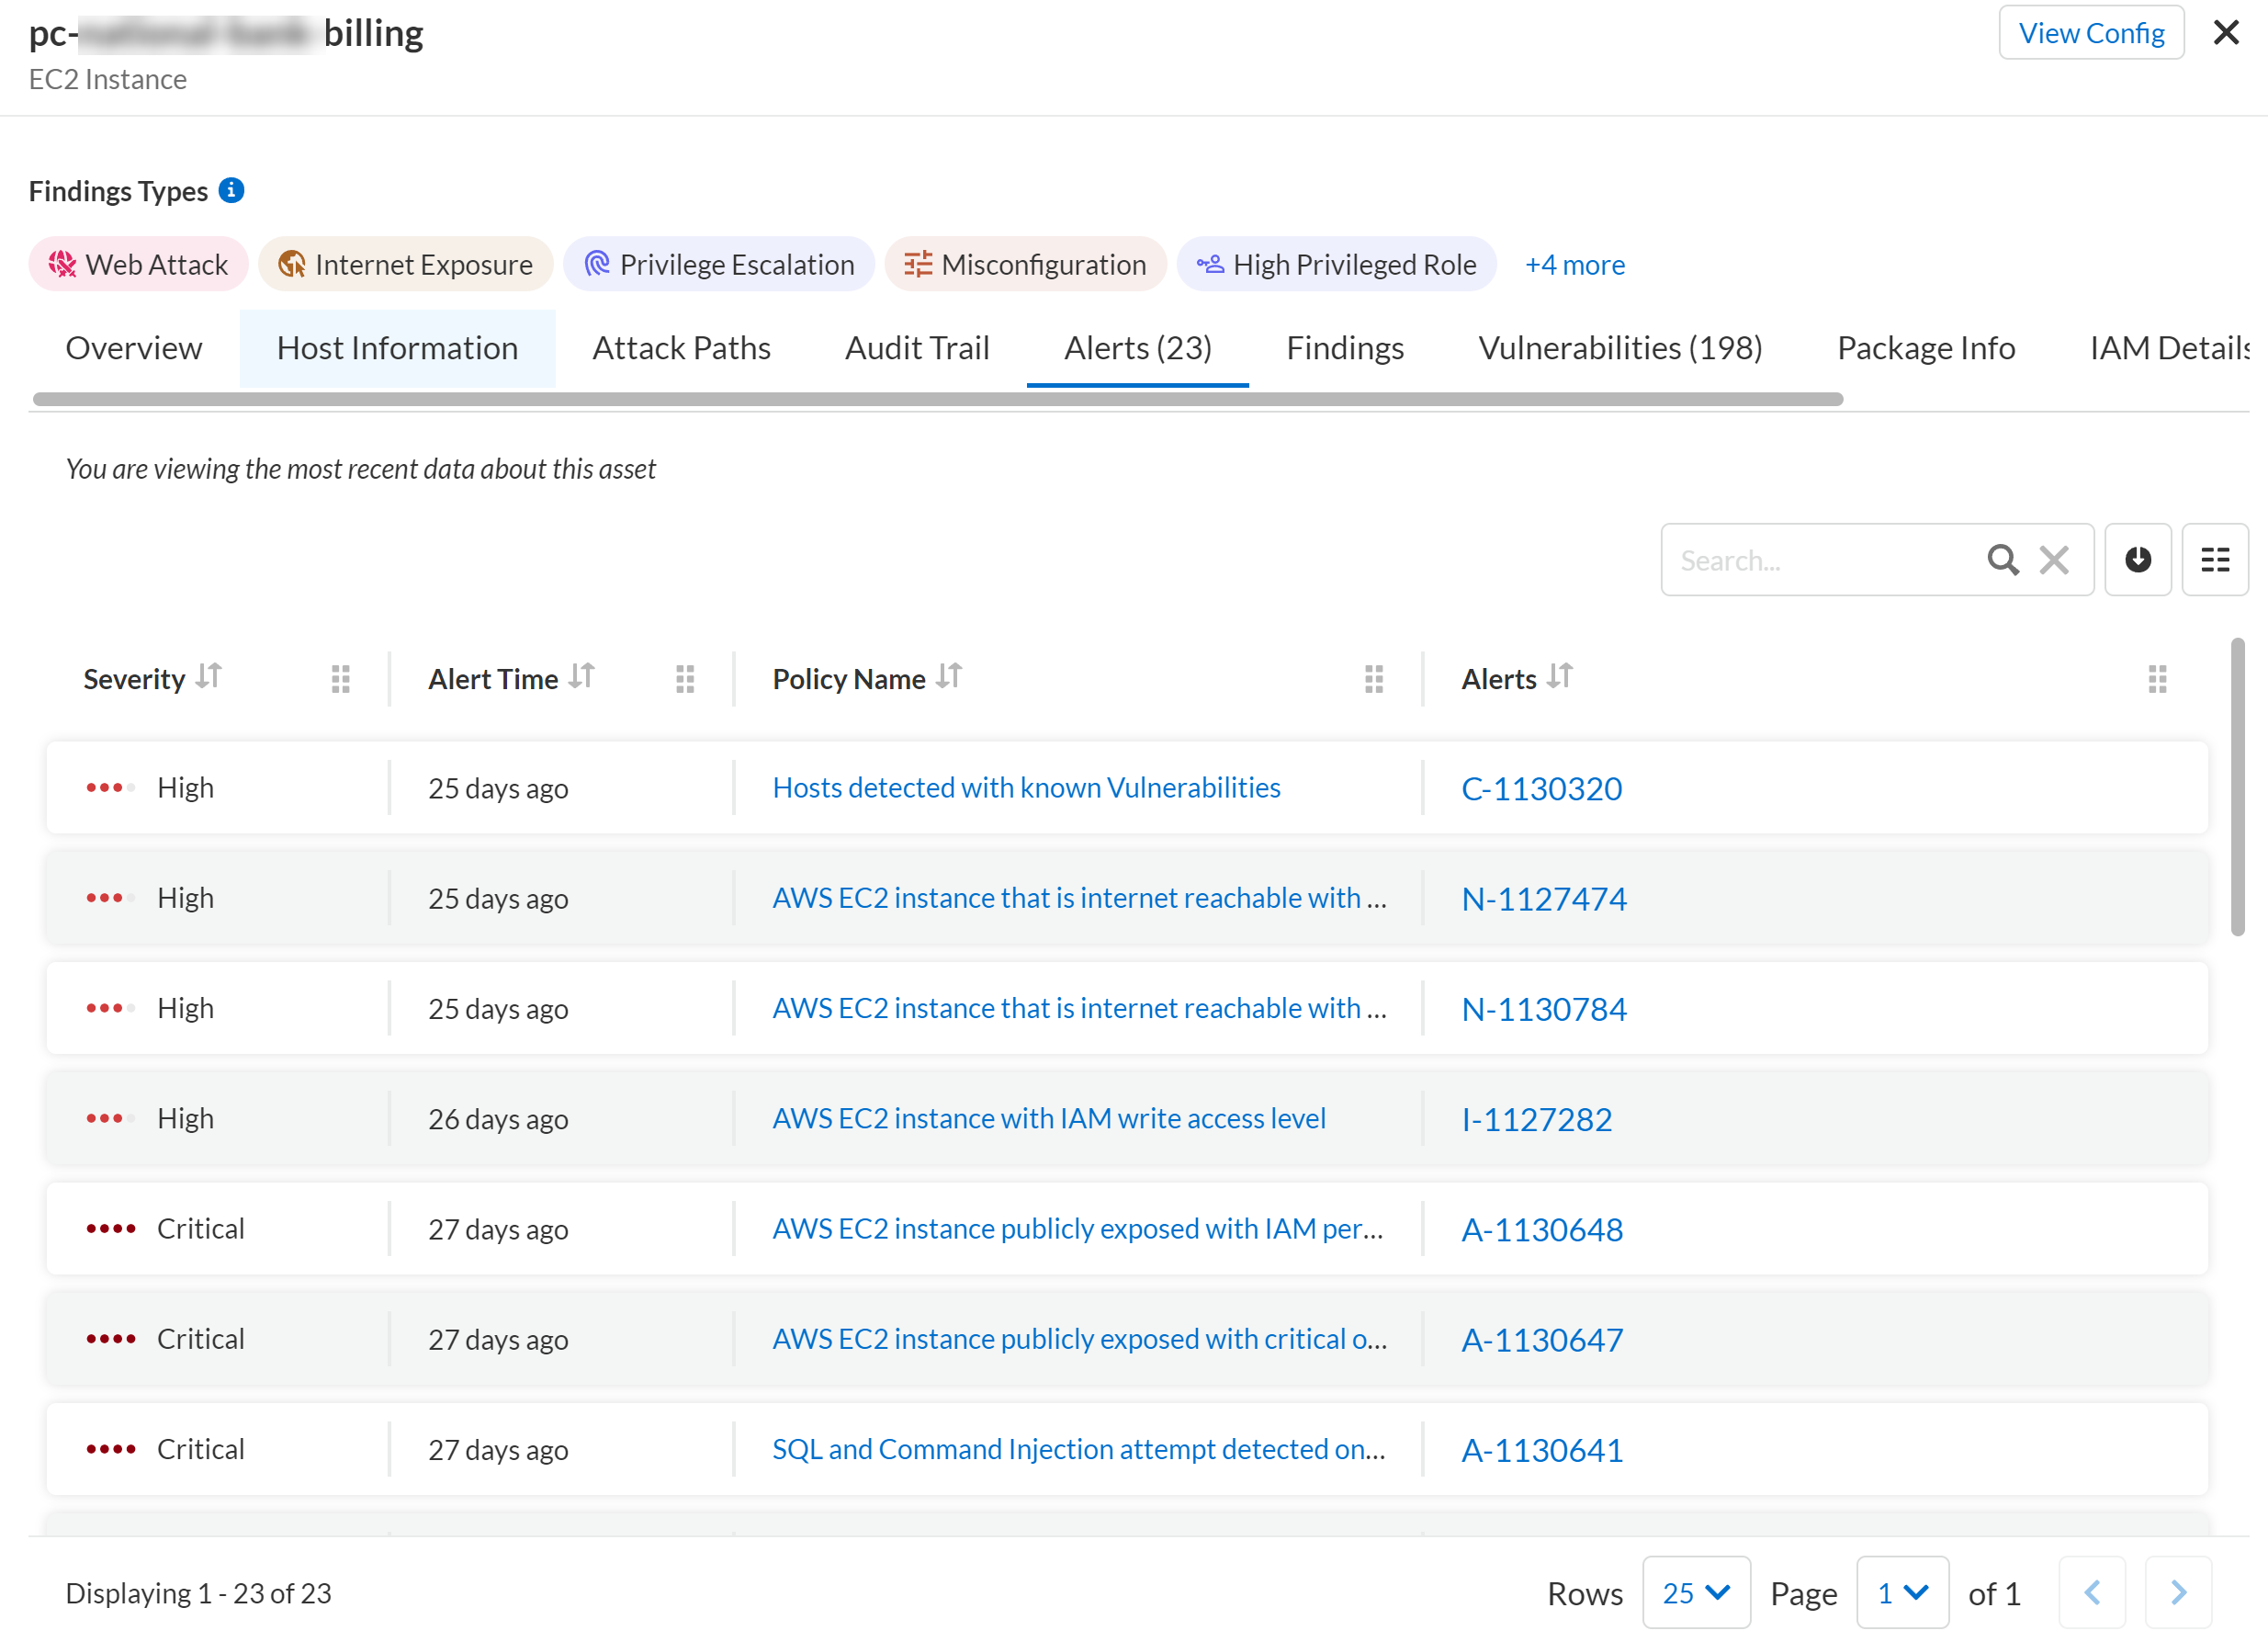
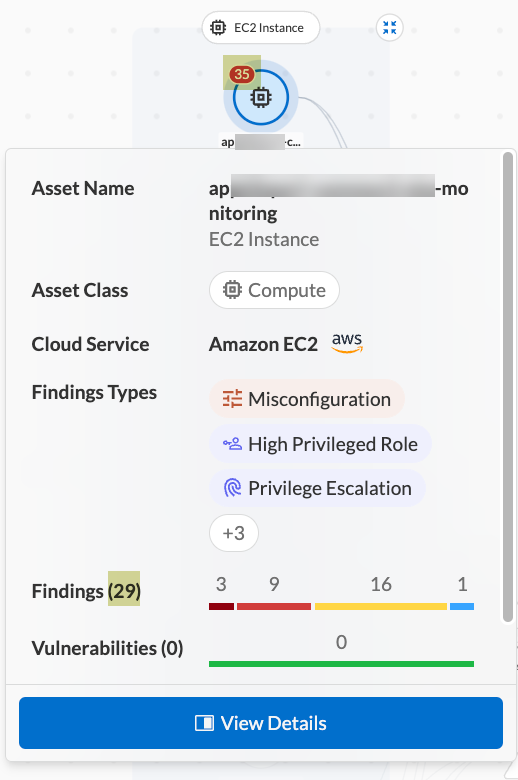
In the **Graph** mode, you can select a node to preview the highlights. Select **View Details** to view the asset details. **Attack Paths** display the attack paths applicable to the particular asset. **Alerts** display the alert details.
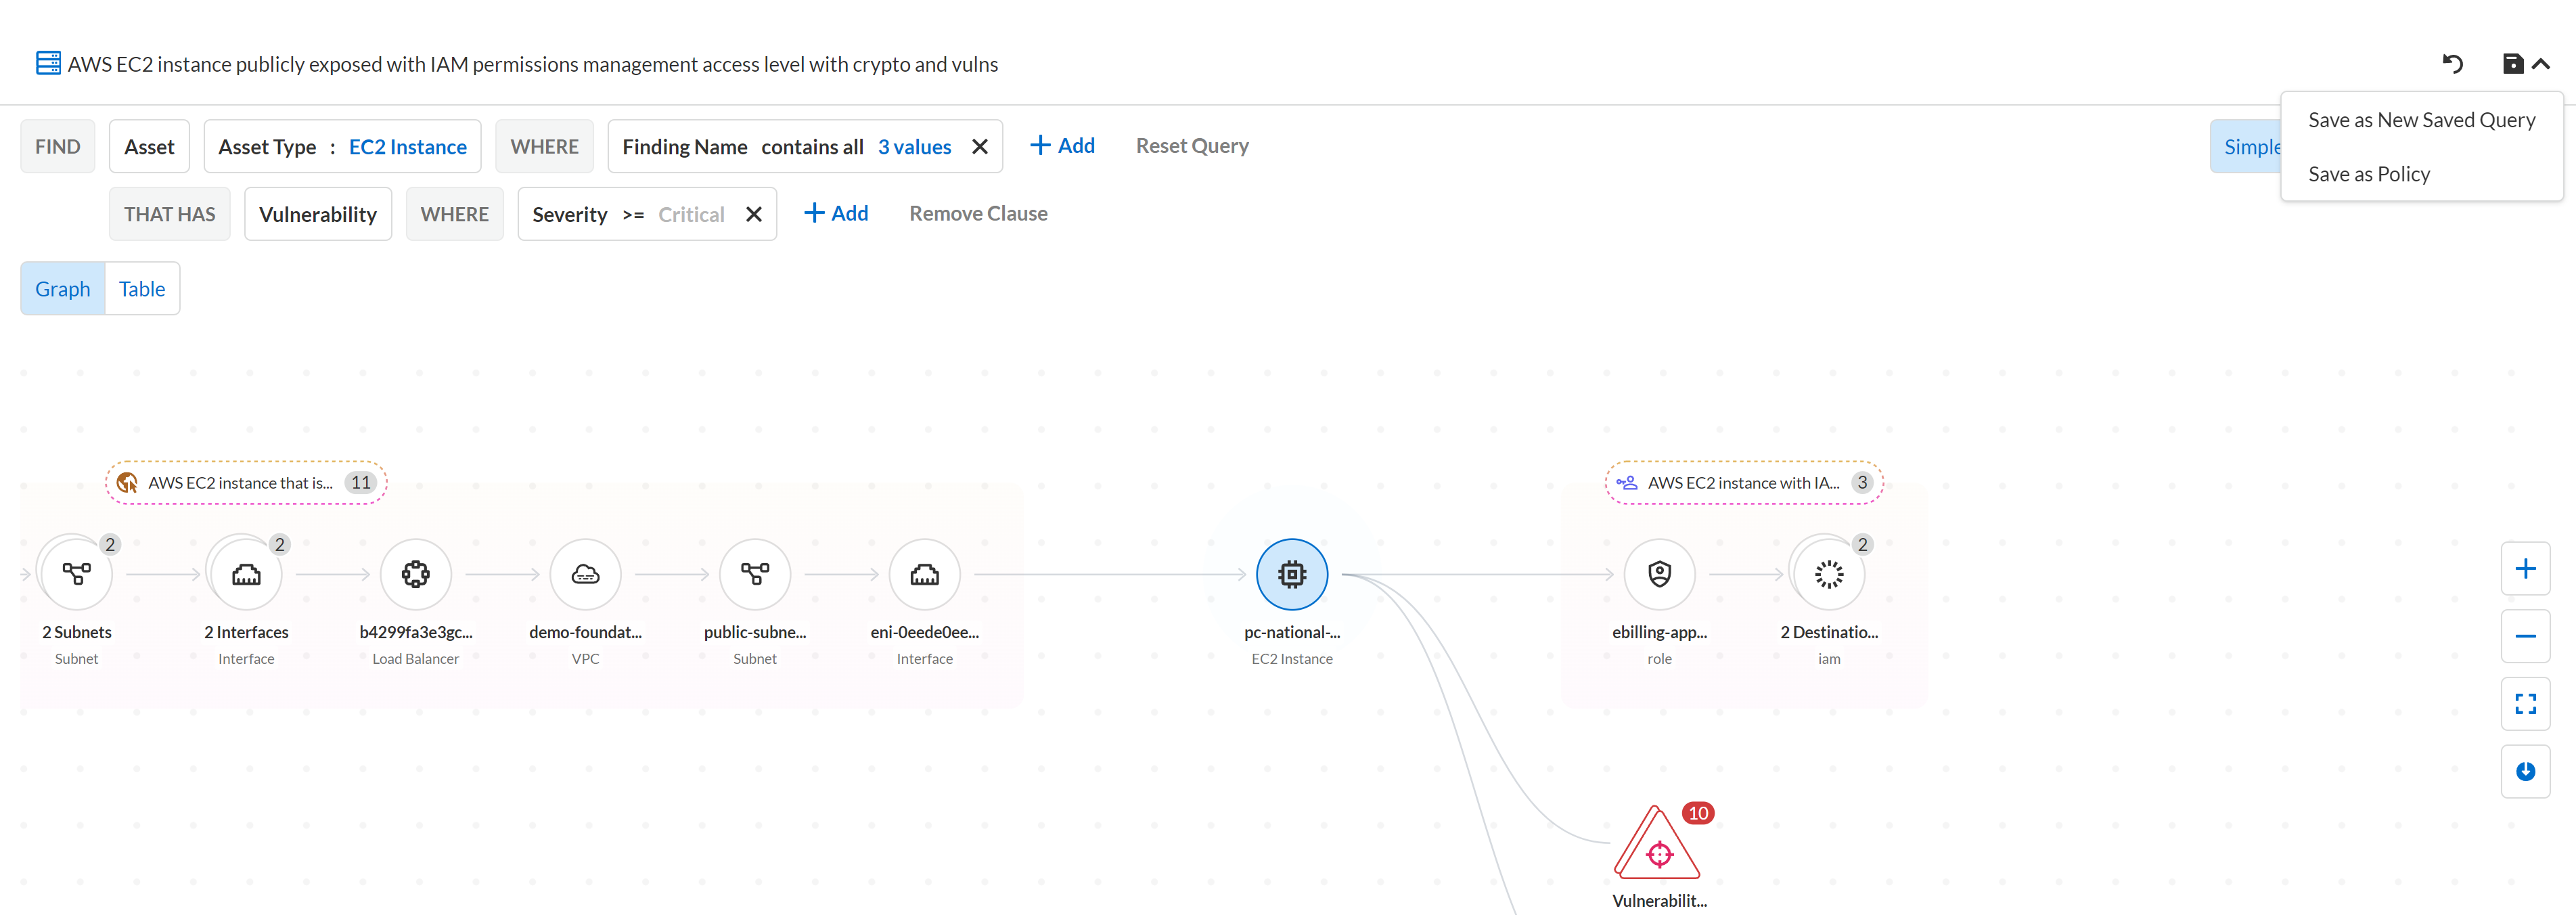
The graph displays nodes and edges. However, there still can be too many results for you to take any meaningful action. To narrow down your search and cater to your specific needs, you can refine your query with a few simple clicks and add additional context. For example, you can add more asset types to broaden the scope if needed, or introduce new findings into the combination, or add other filters such as, cloud accounts to focus on a specific team or business unit.
In this case, consider you want to find out if any bad actor is utilizing these factors to conduct crypto mining activities. You can simply search for *crypto* and add this finding to your query. If you also want to specifically find assets with critical vulnerabilities, you can easily add the corresponding filters before running the search again.
After re-running the search, you will get a newly rendered graph and your search results have narrowed down from many options to the most important one to help you focus. This also allows you to see not only what could go wrong, but also what has gone wrong in your environment. Finally, you can also expand the vulnerability group to view the specific CVEs and trigger remediation actions directly from here.
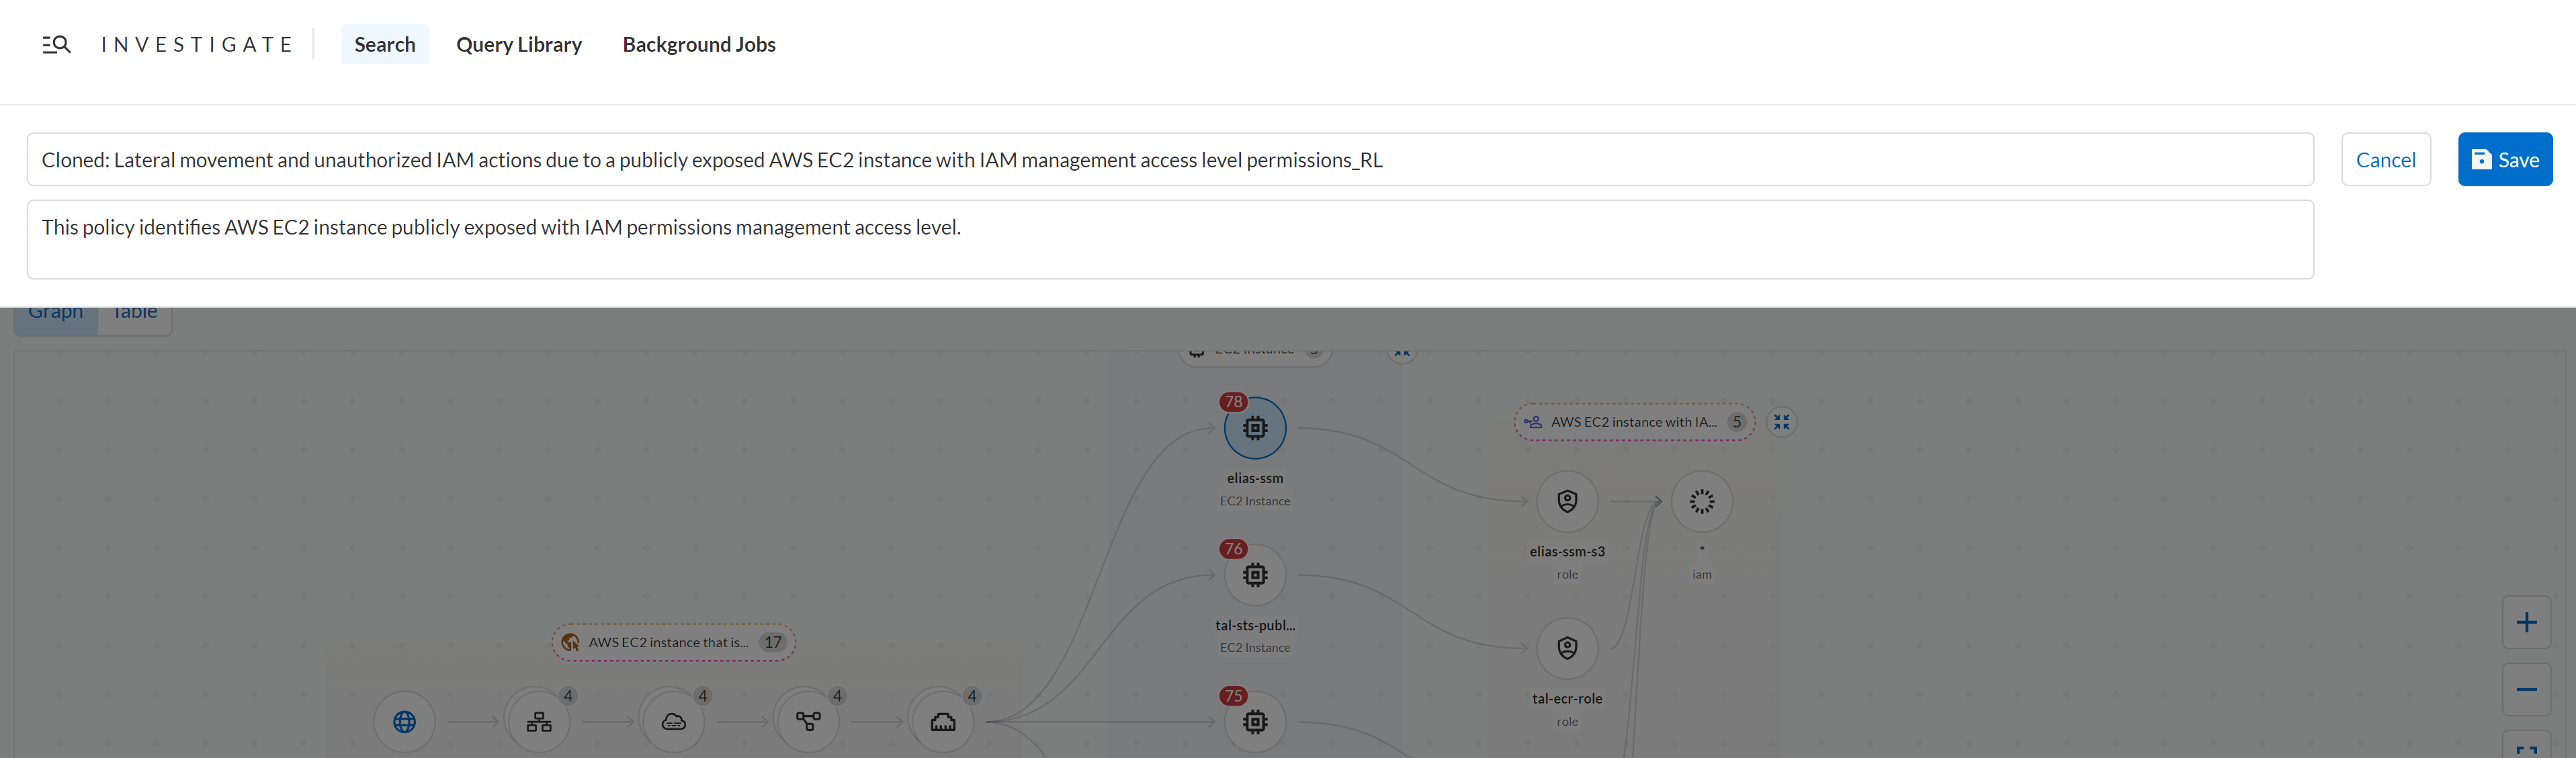
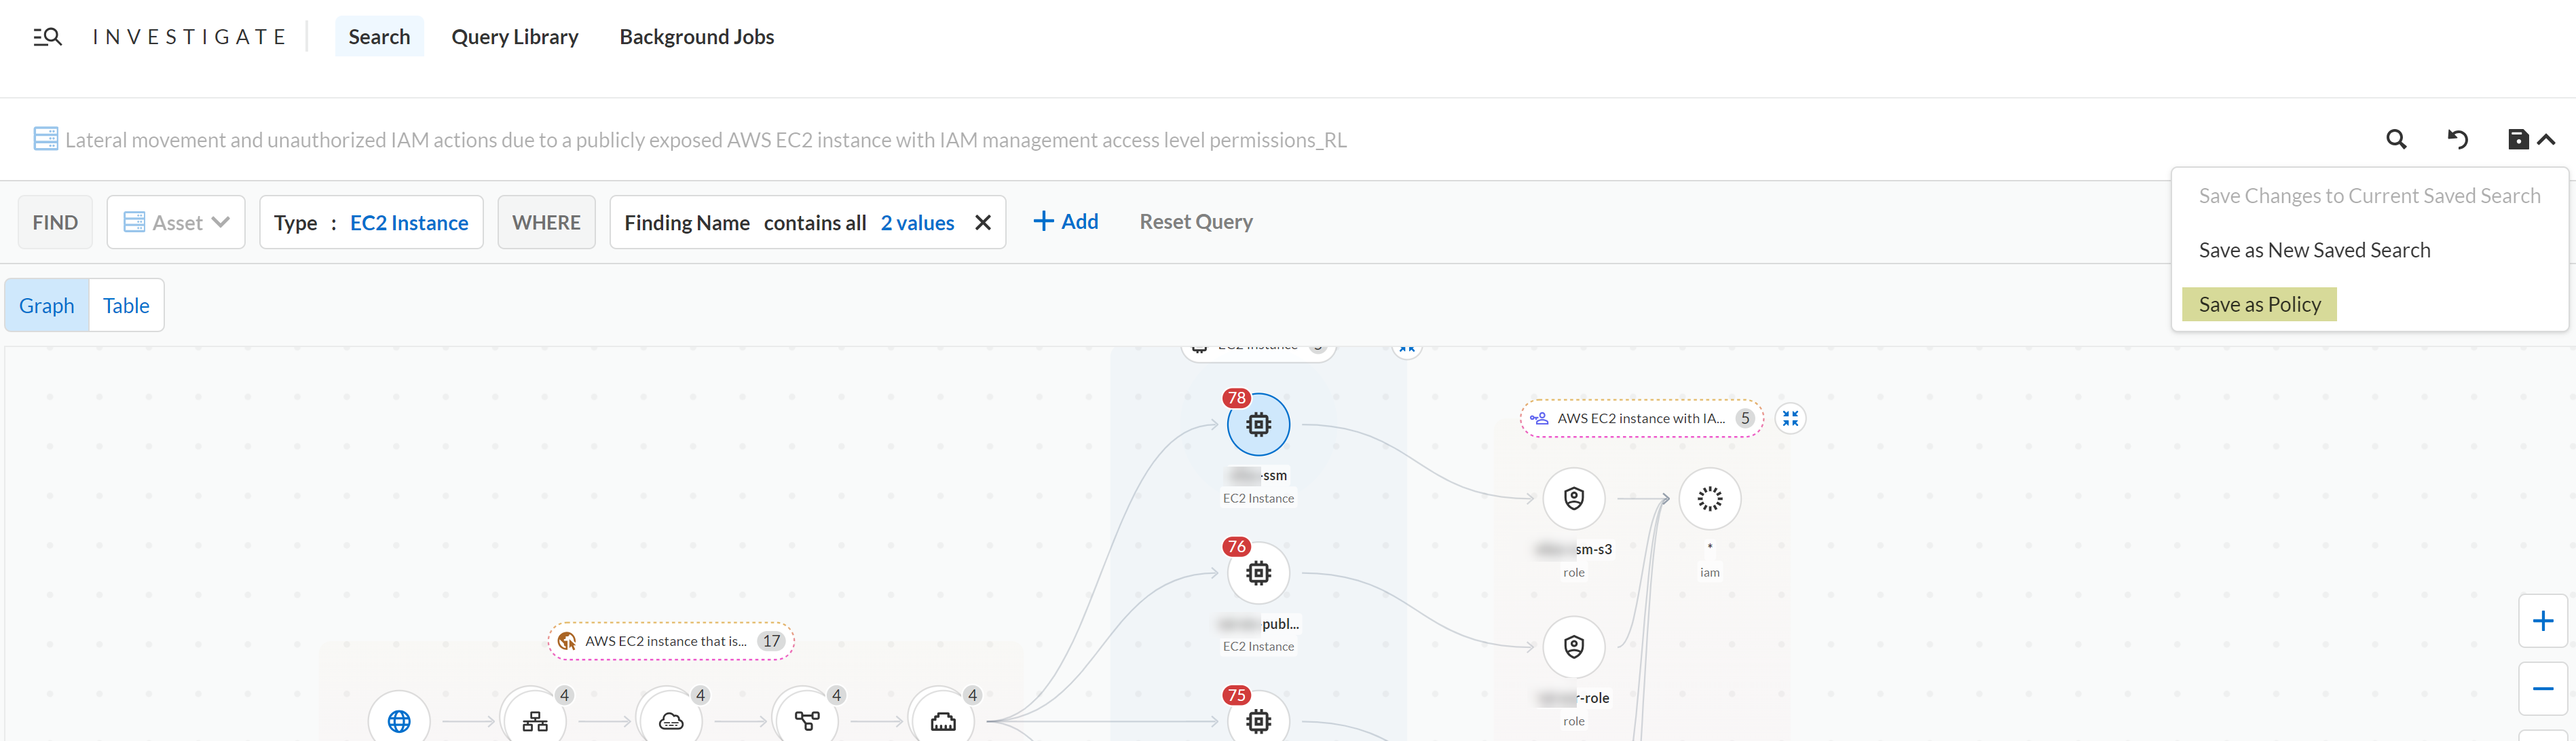
Next, you can select **Save > Save as New Saved Search**, update the query title and description, and **Save** this as a new query. By default, the title for the query will be **Cloned:\**.
The **Findings** count displayed on the node icon (for example, 35) does not match the number displayed next to **Findings** in the preview card (for example, 29). Refer to the **Findings** number displayed in the preview card (29) since it’s near realtime and provides a more accurate count.
## Create Custom Attack Path Policies
Most enterprises have specific requirements and want to create custom policies that are aligned with the organizational needs. After you have searched for assets based on asset attributes and security contexts, you can create custom policies for risky assets to better remediate risks and secure your cloud environments.
In the above example when you narrowed your search results to a specific query, you found a very unique and valuable attack path. Now, you have to make sure that there is a security guardrail to automatically alert your security teams if your application is at risk with this combination.
In order to save your query as a custom Attack Path policy, make sure you have selected **Asset Type** and **Finding Name** when you create the query.
* Select **Save > Save as Policy**. Prisma Cloud saves the search before converting it to a policy.
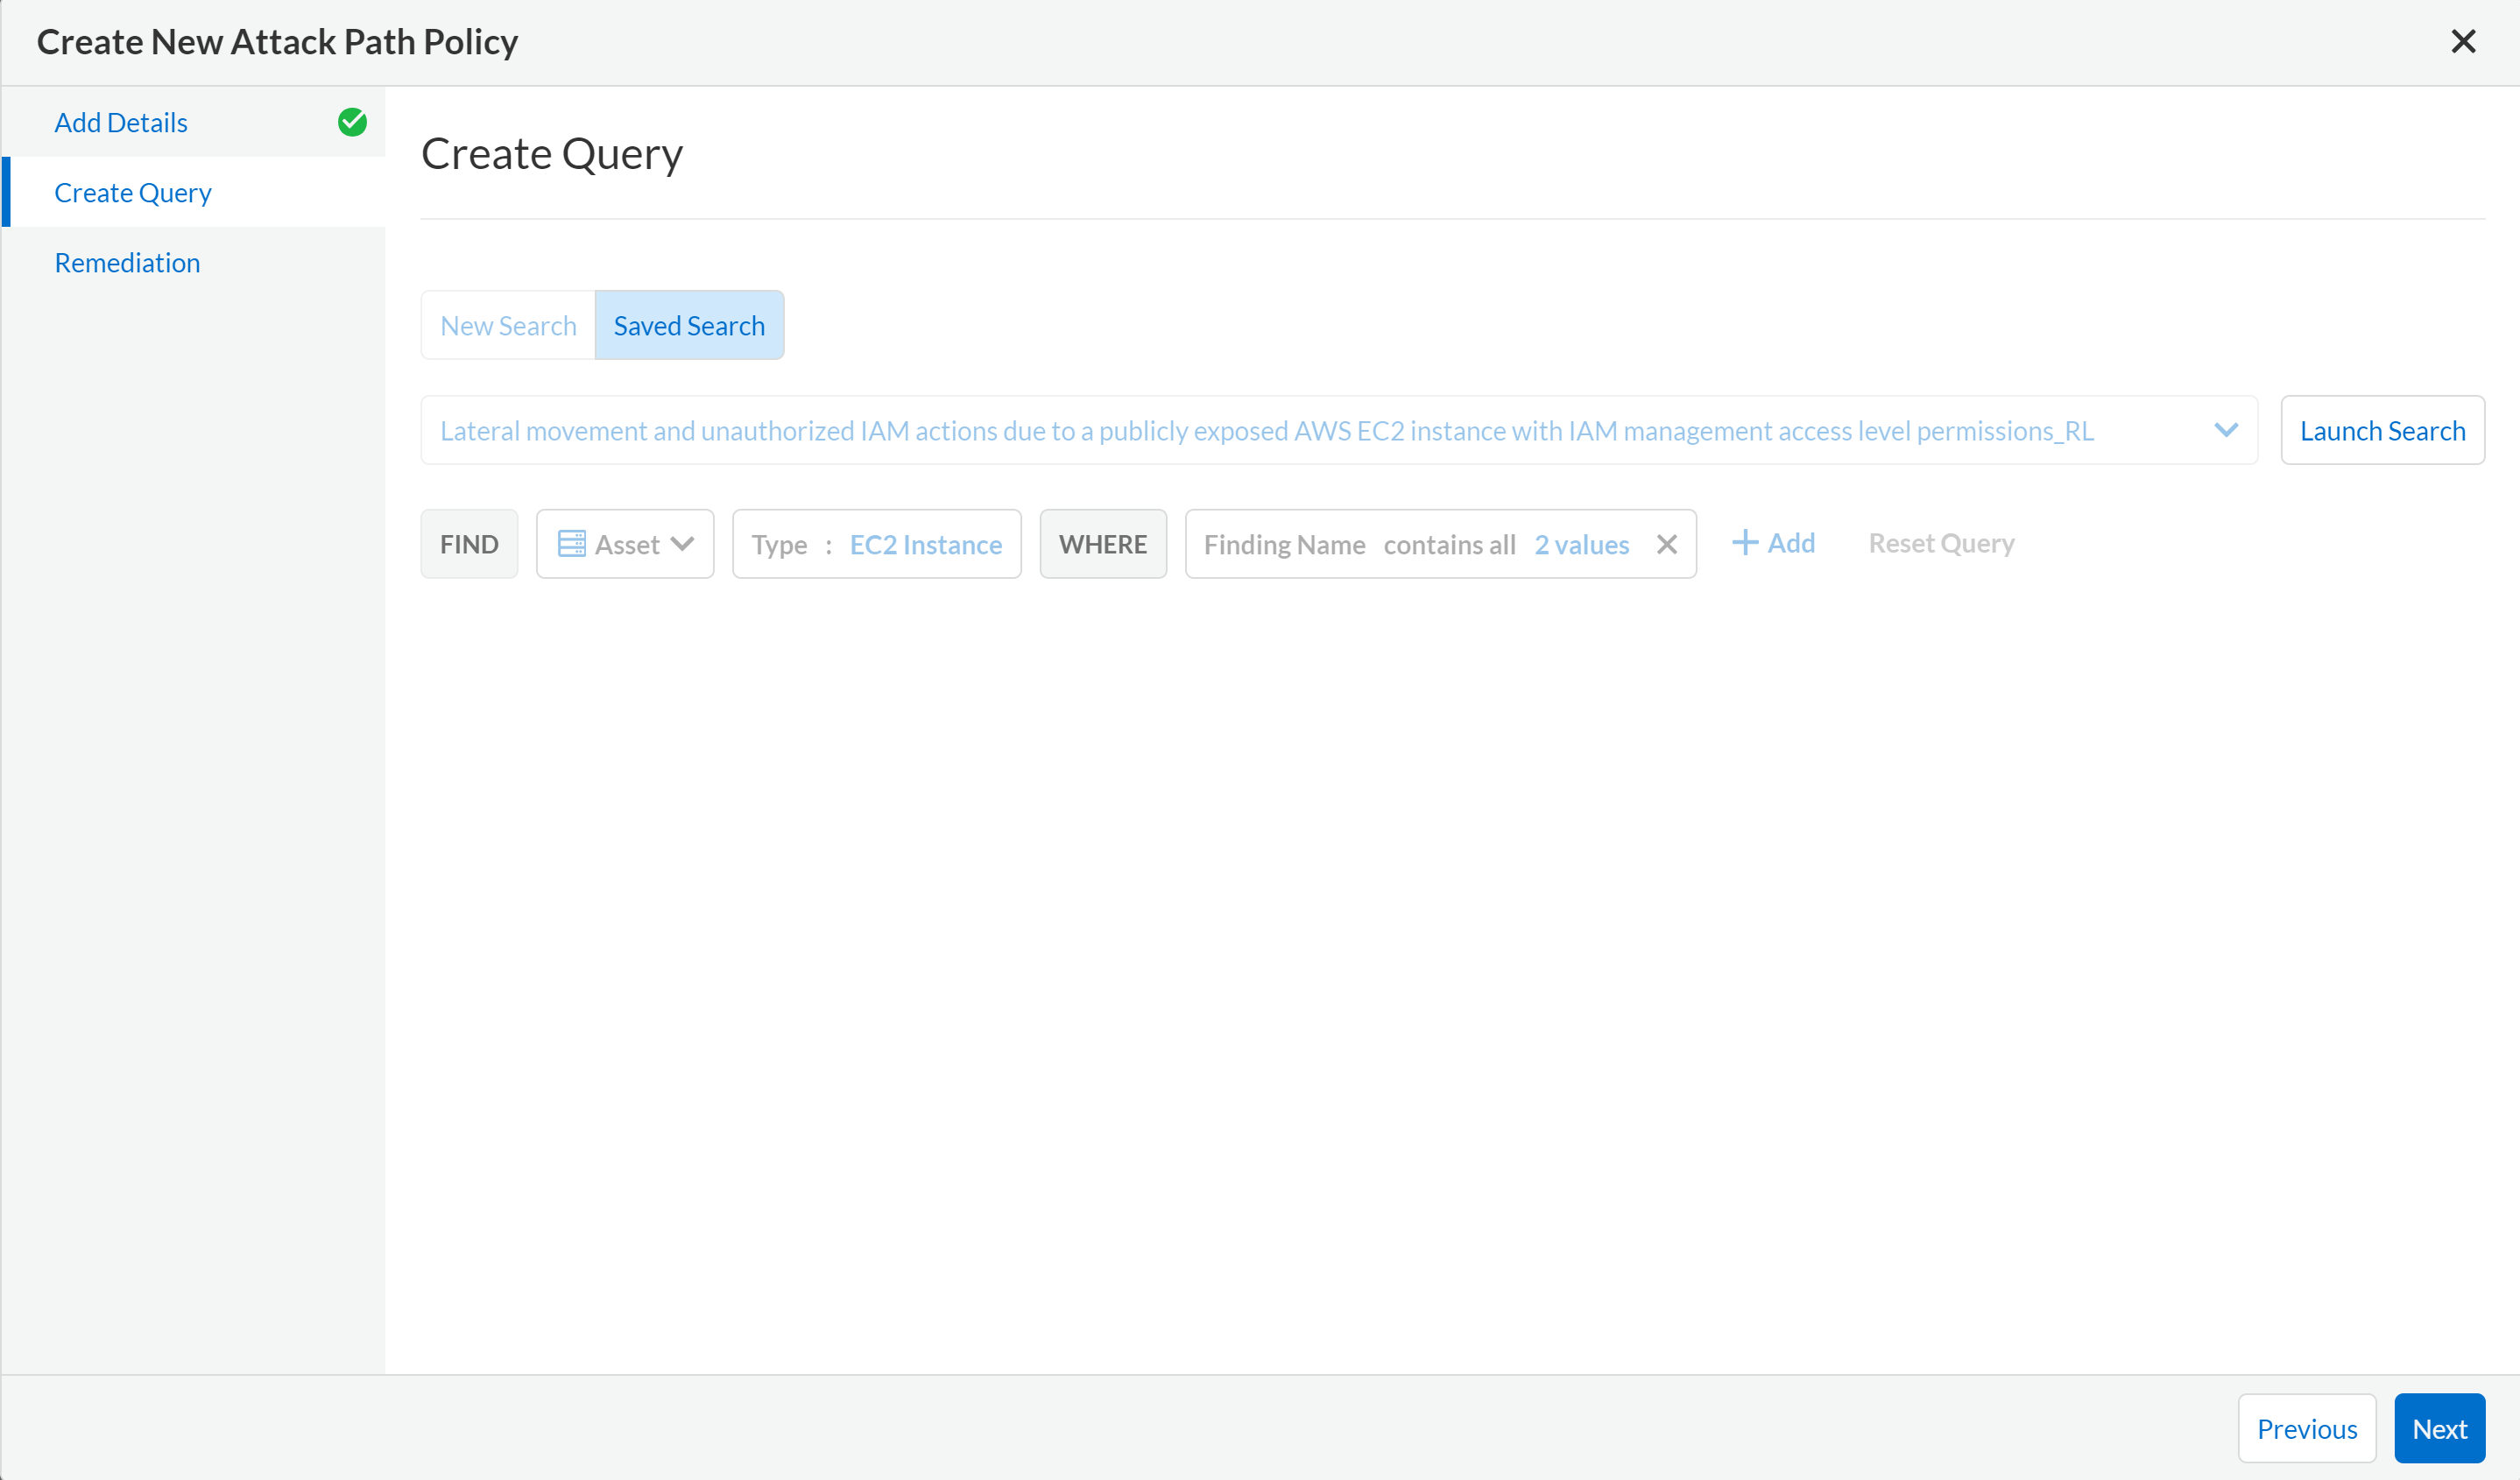
* Select **Save and Create Policy** to add or update policy name, description (optional), severity, and labels (optional).
* In **Create a Query**, use the saved search or update the findings and launch a new search.
* Add **Recommendation for Remediation** (optional) and select **Submit** to create a new Attack Path policy based on the saved query.
With the powerful graph visualization provided by Prisma Cloud, you can now easily set up custom policies to further improve your security posture.
To save your **Asset** RQL queries as **Attack Path Policies**, consider the following points:
* For asset descriptor, Prisma Cloud only supports Asset Type and does not support Cloud Service or Asset Class.
* Prisma Cloud only allows a single Asset Type value in policy RQLs.
* For asset attributes, Prisma Cloud only supports Finding Name attribute in policies, which is also mandatory for Attack Path policies. If you include any other attributes such as, Asset ID, Asset Name, or Finding Type, you cannot save the query as a policy.
* For Finding Name, Prisma Cloud only supports referencing a total of up to 10 findings.
* All vulnerability attributes are supported in policy RQL.
---
# Agent Instructions
This documentation is published with GitBook. GitBook is the documentation platform designed so that both humans and AI agents can read, navigate, and reason over technical content effectively. Learn more at gitbook.com.
## Querying This Documentation
If you need additional information that is not directly available in this page, you can query the documentation by asking a question.
Perform an HTTP GET request on the following URL with the `ask` and `goal` query parameters:
```
GET https://docs.prismacloud.io/content-collections/search-and-investigate/explore-data.md?ask=&goal=
```
`ask` is the immediate question: it should be specific, self-contained, and written in natural language.
`goal` is what the user is ultimately trying to achieve, the reason they need the answer. Sharing it helps GitBook give you a better, more relevant answer. A goal is most helpful when it describes the outcome the user wants rather than restating the question. For example, with `ask=how do I create an API token`, a goal like `automate deployments from our CI pipeline` lets GitBook tailor the answer to that use case.
The response will contain a direct answer to the question and relevant excerpts and sources from the documentation.
Use this mechanism when the answer is not explicitly present in the current page, you need clarification or additional context, or you want to retrieve related documentation sections.